Podmienky obchodovania
Nástroje

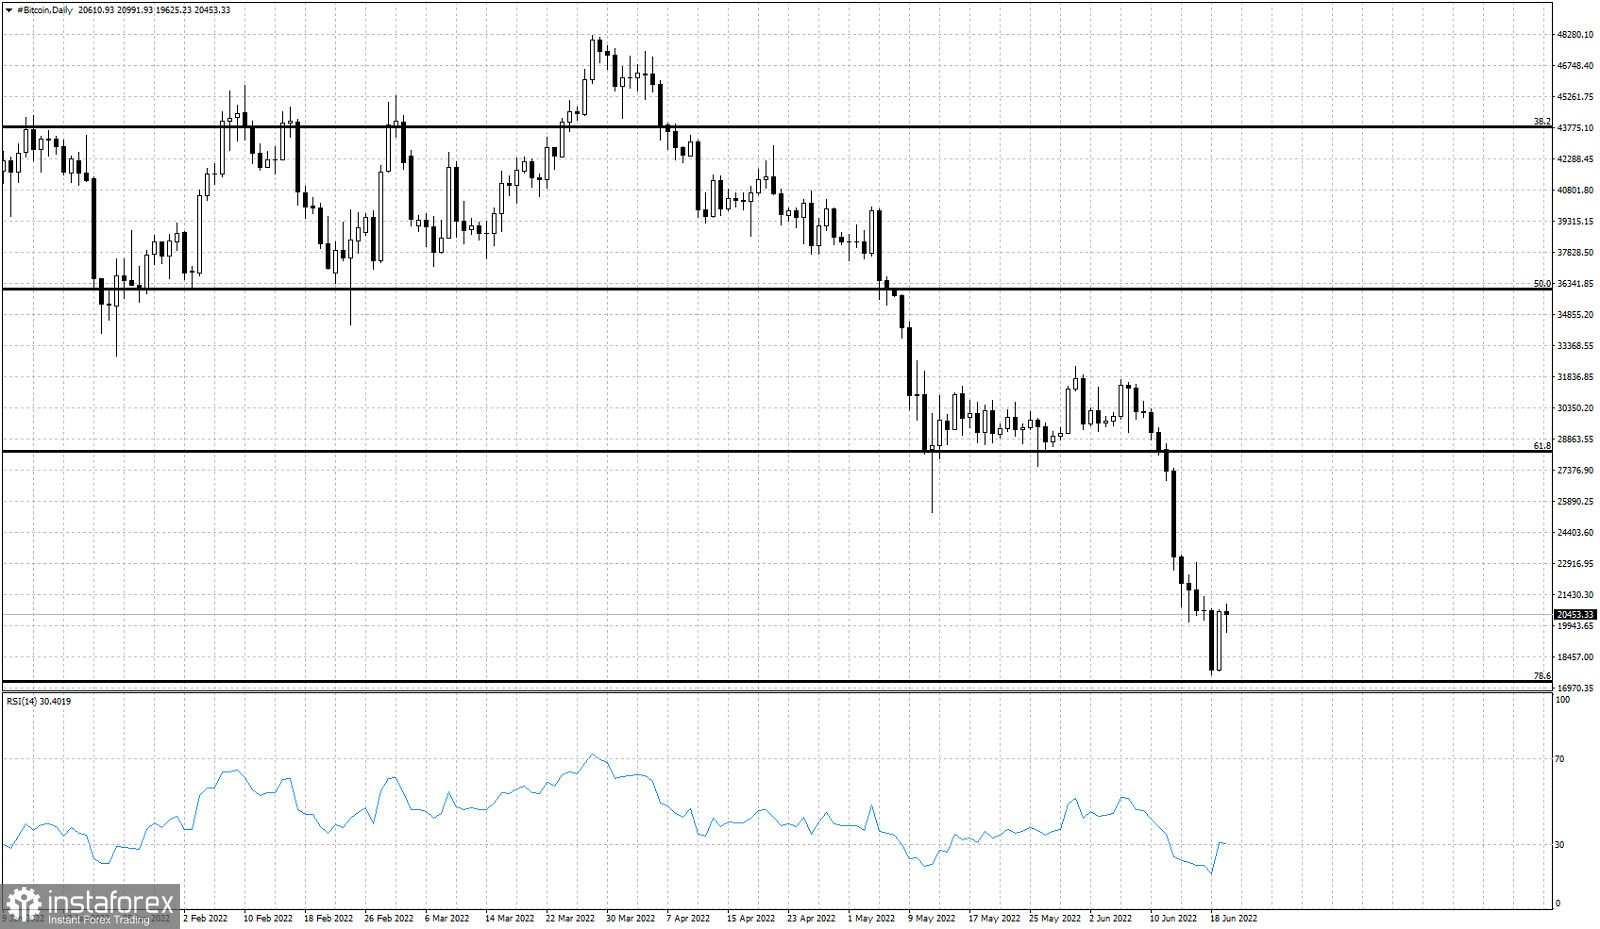
Black lines- Fibonacci retracement levels
Bitcoin technically remains in a bearish trend. Over the last few weeks we have given several warnings to bulls that if specific price levels were broken, price would fall towards $20,000 and lower. In our most recent analysis we noted that a break below the 61.8% Fibonacci retracement was a new bearish signal and price was expected to continue lower towards the 78.6% retracement level. Price over the weekend has reached our target area and is now bouncing off support. The RSI from oversold levels is bouncing higher and this is normal after such a long down trend. The RSI has made new lower lows. There is no sign of a bullish divergence. This means that any upside bounce should be short-lived. Bitcoin price chart justifies a bounce towards $25,000-$27,000 but it will be considered as a counter trend bounce. Over the last few years we have witnessed such deep pull backs in Bitcoin price. It is not the first time we see a more than 70% decline after a strong rally. Is this time going to be different?In any case, I do not see the formation of a major low or the signs of a major reversal yet.
InstaForex analytical reviews will make you fully aware of market trends! Being an InstaForex client, you are provided with a large number of free services for efficient trading.
Súbory cookie môžeme používať na analýzu údajov o návštevníkoch webovej stránky, na jej zlepšenie a meranie výkonu reklamy. Tieto údaje sa vo všeobecnosti používajú na zlepšenie poskytovaných služieb na webovej stránke. Ďalšie informácie.
Your IP address shows that you are currently located in the USA. If you are a resident of the United States, you are prohibited from using the services of Instant Trading EU Ltd including online trading, online transfers, deposit/withdrawal of funds, etc.
If you think you are seeing this message by mistake and your location is not the US, kindly proceed to the website. Otherwise, you must leave the website in order to comply with government restrictions.
Why does your IP address show your location as the USA?
Please confirm whether you are a US resident or not by clicking the relevant button below. If you choose the wrong option, being a US resident, you will not be able to open an account with InstaForex anyway.
We are sorry for any inconvenience caused by this message.
 Zostať


