 Zostať
Podmienky obchodovania
Nástroje


EUR/USD 5M
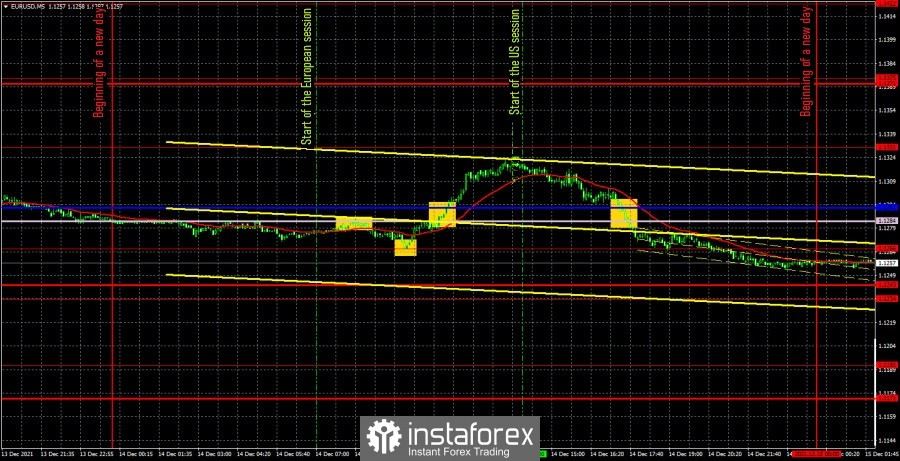
The EUR/USD pair continued to remain between the levels of 1.1266 and 1.1324 on Tuesday, that is, inside the horizontal channel. This is better seen on an hourly timeframe than on a 5-minute one. However, despite the fact that the pair is flat, its daily volatility is still not low. Therefore, we get an unusual picture. On the one hand, it is flat, in which it is inconvenient and difficult to trade a priori. On the other hand, there is still volatility, and signals are being formed. It should also be noted right away that important macroeconomic statistics were not published either in the European Union or in the United States. The report on industrial production in the EU was not only not the most significant (especially on the eve of the European Central Bank and Federal Reserve meetings), but also almost completely corresponded to the forecast value. Thus, traders again had to trade exclusively on technical factors during the day. There were few signals formed on Tuesday. The first one - for short positions - was formed after a rebound from the Senkou Span B line, and traders immediately faced the same problem as the day before, since there were only 18 points to the nearest target. At the time of the formation of this signal, the price was already at a distance of 10 points from the level of 1.1266. Thus, this signal should have been filtered out. The same is true with the second buy signal in the form of a rebound from the level of 1.1266. It was only possible to open long positions when the pair overcame the Senkou Span B and Kijun-sen lines. Unfortunately, the price could not reach the nearest level of 1.1331 without reaching it by only 6 points. The long position closed at breakeven on Stop Loss. The last sell signal should also have been ignored, as the problem of finding the target level too close again had emerged. As a result, there were neither profits nor losses on Tuesday.
EUR/USD 1H
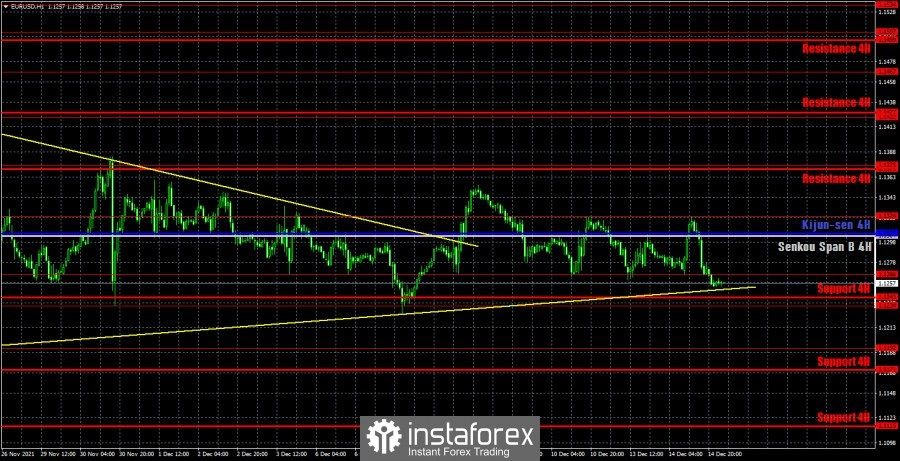
On the hourly timeframe, the pair with great difficulty maintains a new upward trend, but at the same time is in no hurry to grow. In recent days, there has been a flat between the levels of 1.1266 and 1.1324. Thus, the lines of the Ichimoku indicator now have almost no value. It doesn't make sense to guess at all now what the technical picture will be after Wednesday. The rising trend line is very weak and it will not be difficult to overcome it. We highlight the following levels for trading on Wednesday – 1.1192, 1.1234, 1.1266, 1.1324, 1.1375, as well as the Senkou Span B(1.1304) and Kijun-sen(1,1307) lines. The lines of the Ichimoku indicator may change their position during the day, which should be taken into account when searching for trading signals, but during a flat they are very weak and can even be ignored. Signals can be rebounds or breakthroughs of these levels and lines. Do not forget about placing a Stop Loss order at breakeven if the price moves 15 points in the right direction. This will protect you against possible losses if the signal turns out to be false. There will not be a single important fundamental event or macroeconomic report in the European Union on December 15. A relatively important retail sales report will be published in America during the day, and the results of the Fed meeting will be announced late in the evening and a press conference with Jerome Powell will be held.
We recommend you to familiarize yourself:
Overview of the EUR/USD pair. December 15. Fed monetary policy in 2022: a fortune-telling on the coffee grounds.
Overview of the GBP/USD pair. December 15. The UK could be swept up by the omicron strain in January 2022.
Forecast and trading signals for GBP/USD for December 15. Detailed analysis of the movement of the pair and trade deals.
Analysis of the COT report
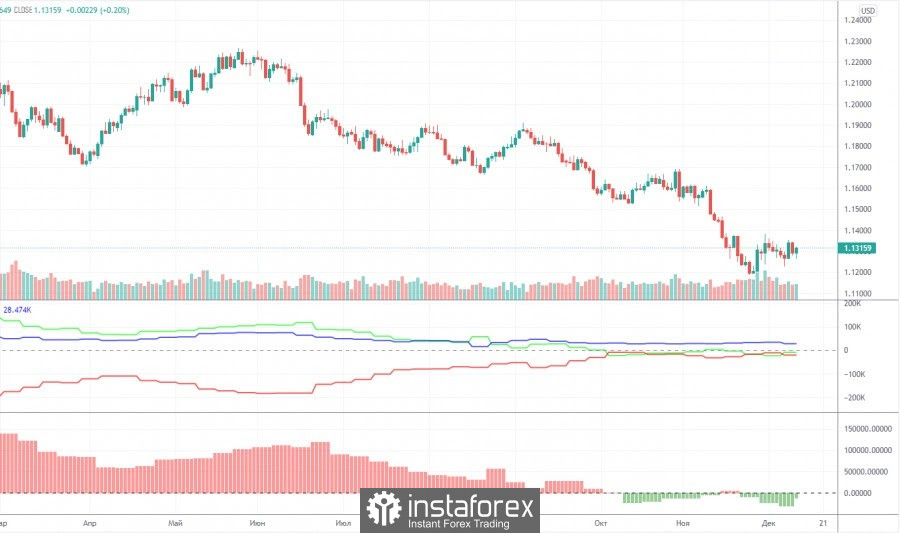
The mood of non-commercial traders became... less bearish again during the last reporting week (November 30 – December 6). What does it mean? This means that the group of "non-commercial" traders now has more open short positions than long ones, but at the same time, the number of sell contracts (shorts) has decreased over the past week. To be precise, it decreased by 15,000, and the number of longs increased by 2,000. Thus, the net position of professional players increased by 17,000, respectively, the bearish mood became less strong. However, it was not strong, and the trend is important to us first of all. And that's just with the trend lately, everything is bad... The fact is (and it is perfectly noticeable in the chart above) that the green and red lines (net positions of non-commercial and commercial traders) have been tightly stuck near the zero level in recent months. This means that now the mood of both groups of traders is as neutral as possible. Nevertheless, all this time the European currency continues to fall, which already looks like a correlation between the actions of major market participants and the movement of the euro exchange rate. So far, this can be attributed to chance, but the bearish mood in the euro has not intensified in recent weeks and months. Thus, it is impossible to say that major players continue to get rid of the euro currency. From this point of view, it can be assumed that the downward trend is nearing its end, but at the same time you should wait for strong technical signals to start opening long positions.
Explanations for the chart:
Support and Resistance Levels are the levels that serve as targets when buying or selling the pair. You can place Take Profit near these levels.
Kijun-sen and Senkou Span B lines are lines of the Ichimoku indicator transferred to the hourly timeframe from the 4-hour one.
Support and resistance areas are areas from which the price has repeatedly rebounded off.
Yellow lines are trend lines, trend channels and any other technical patterns.
Indicator 1 on the COT charts is the size of the net position of each category of traders.
Indicator 2 on the COT charts is the size of the net position for the non-commercial group.
InstaForex analytical reviews will make you fully aware of market trends! Being an InstaForex client, you are provided with a large number of free services for efficient trading.


