 Zostať
Podmienky obchodovania
Nástroje


Weekly data on applications for US unemployment benefits showed a 47,000 drop in total.
Statistics details:
The volume of initial applications for benefits increased from 225 thousand to 248 thousand.
The volume of repeated applications for benefits decreased from 1,708 thousand to 1,638 thousand.
Analysis of trading charts from February 17:
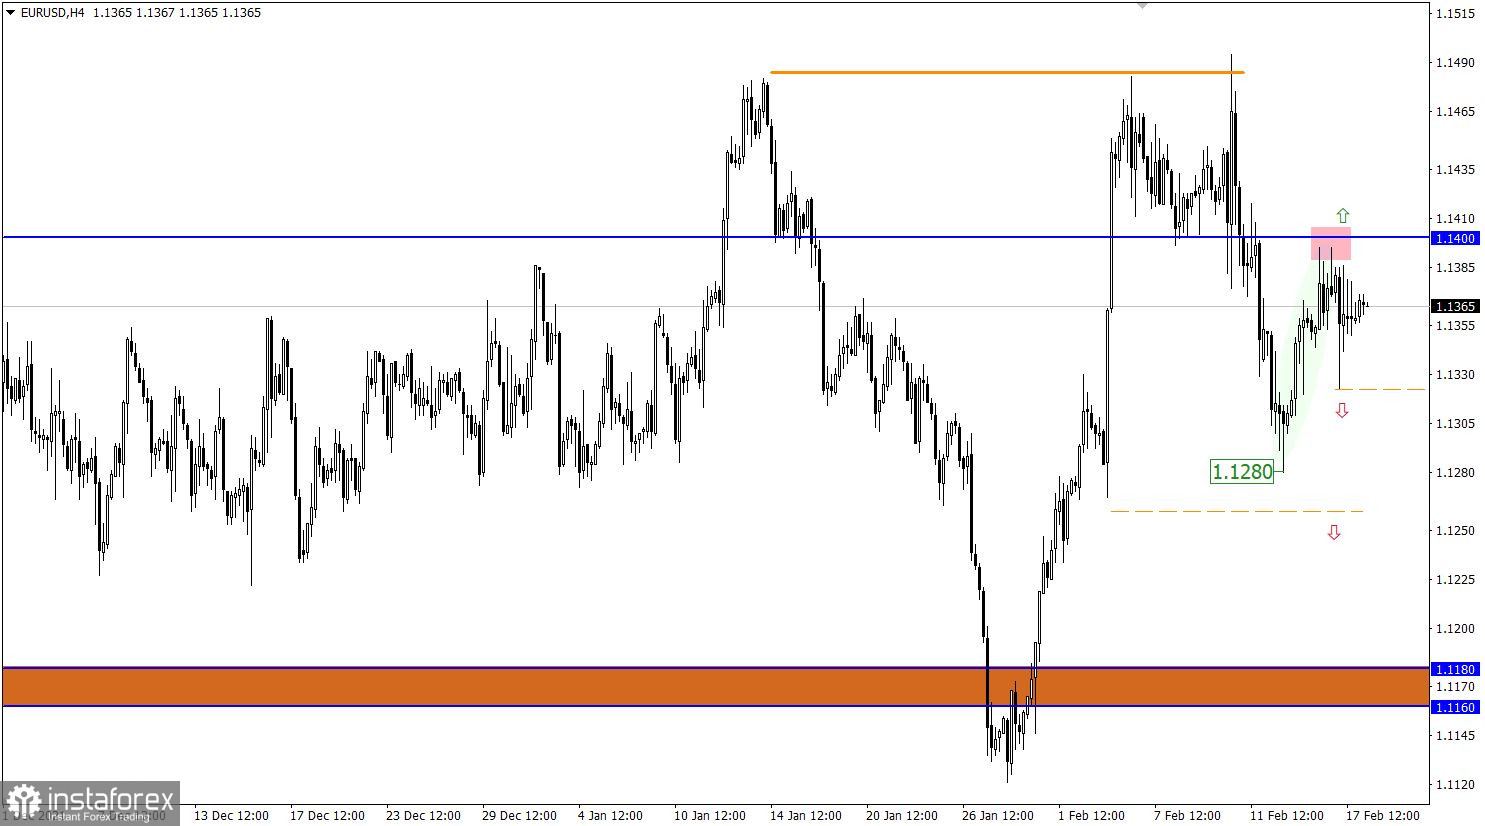
The EUR/USD pair slowed down again after a slight rebound from the resistance level of 1.1400. A series of Doji-type candles in a four-hour period indicate a characteristic uncertainty among market participants. These candles and stagnation are highly likely to lead to another acceleration in the market.
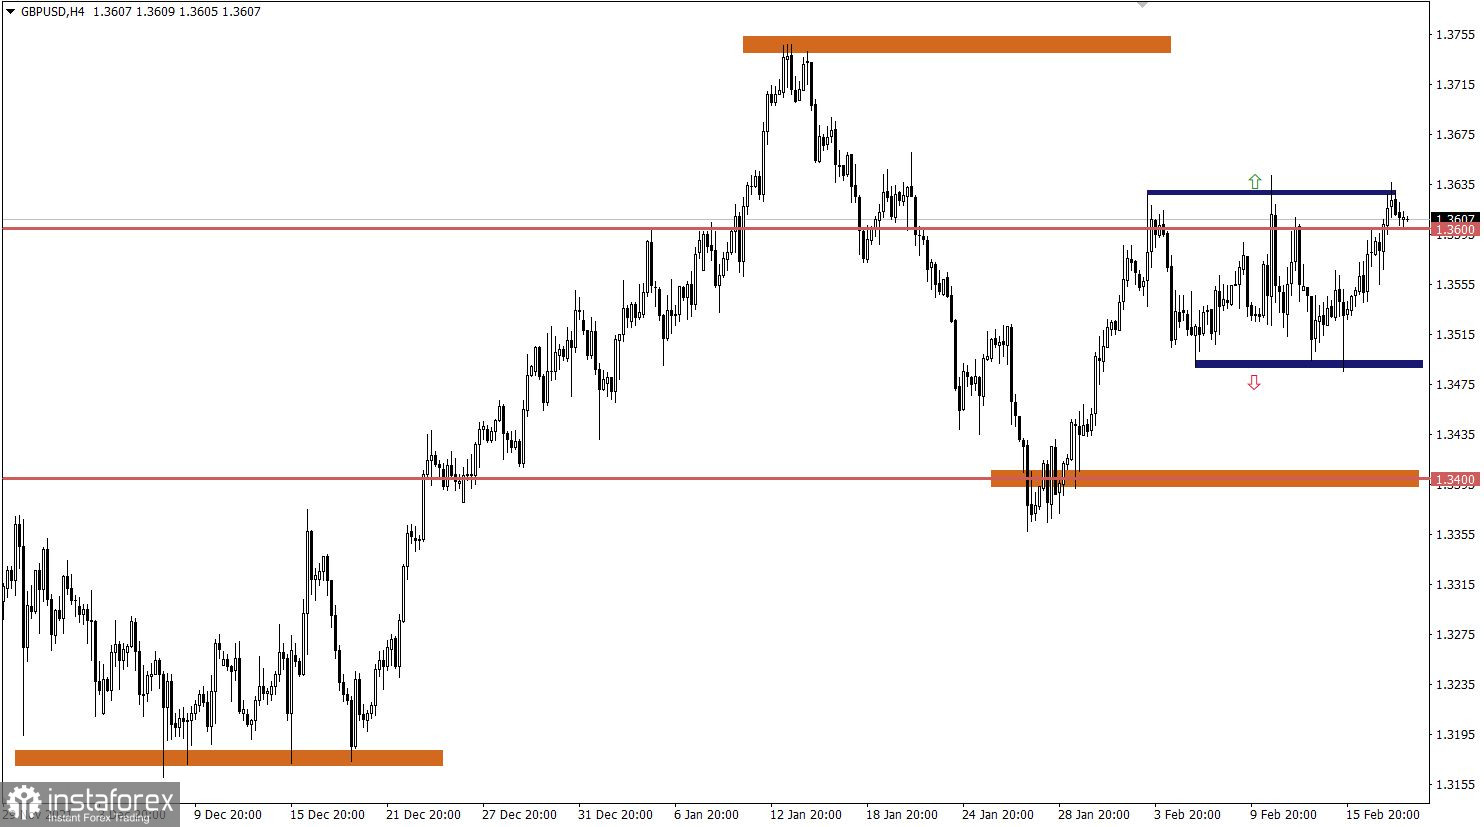
Despite the local breakdown of the upper border of the side channel 1.3500/1.3600, the quote is still within its deviation. So, the levels of 1.3480 and 1.3630 serve as signal levels. Holding the price above one of the levels in a four-hour period would signal the end of the flat. Until then, the side channel remains on the market.
February 18 economic calendar:
The UK's retail sales data was published today at 7:00 Universal time. Its decline of 1.7% was replaced by an increase of 9.1%, which looks fantastic. The pound sterling stagnated during the release of the data.
The data on US sales in the secondary housing market will be published during the American trading session, where a decline of 1% is expected in January. The data is not the best, but they are also published during the closing of European stock exchanges.
Time targeting
Sales on the secondary housing market (Jan) - 15:00 Universal time
Trading plan for EUR/USD on Feb 18:
Judging by the price behavior, traders should pay attention to the borders of the current amplitude 1.1320/1.1400. If we proceed from the process of accumulation of trading forces and Doji candles, then holding the price outside one or another border will lead to a sharp activity surge. This strategy allows traders to enter the market at the start of a momentum.
Let's demonstrate the above-mentioned into trading signals:
Trading plan for GBP/USD on Feb 18:
In this situation, traders are paying special attention to price fluctuations within the upper limit of the flat, as a full-fledged signal to action may appear on the market any minute. The upward movement will be relevant if the price holds above the 1.3630 level in a four-hour period. This step may return traders to the area of the local high on January 13. The downward scenario in the flat structure will be relevant in case of stable price retention below the level of 1.3600.
What is reflected in the trading charts?
A candlestick chart view is graphical rectangles of white and black light, with sticks on top and bottom. When analyzing each candle in detail, you will see its characteristics of a relative period: the opening price, closing price, and maximum and minimum prices.
Horizontal levels are price coordinates, relative to which a stop or a price reversal may occur. These levels are called support and resistance in the market.
Circles and rectangles are highlighted examples where the price of the story unfolded. This color selection indicates horizontal lines that may put pressure on the quote in the future.
The up/down arrows are the reference points of the possible price direction in the future.
InstaForex analytical reviews will make you fully aware of market trends! Being an InstaForex client, you are provided with a large number of free services for efficient trading.

