 Zostať
Podmienky obchodovania
Nástroje


The final data on business activity in Europe, Britain, and the United States came out better than expected, but the overall growth of the indicator did not play into the exchange rate. Perhaps the data has already been taken into account in the quote, or perhaps the general tense situation leads to the neglect of macroeconomic statistics.
Yesterday, the U.S. Federal Reserve System once again made a speech on inflation, the rate, and the tightening of monetary policy. During the period of the speech, the U.S. dollar moved to strengthen.
The main theses of the Fed (05/04/22):
- inflation is too high, there is a risk of further growth
- raising the rate and reducing the Fed's balance sheet will help bring monetary policy to neutral
- The Fed is ready to act more aggressively
- expect the Fed's balance sheet to shrink faster this cycle compared to previous cycles
- we should consider the option of raising the Fed rate by 0.5% immediately
- without a doubt, we need to stop stimulus
- we need to act faster than before
The EURUSD currency pair resumed its decline after a short stop near the local low of last week. This led to a sharp increase in the volume of short positions, where the euro fell below the 1.0900 mark. As a result, the correction move from the 1.0800 support level was won back by more than 78%.
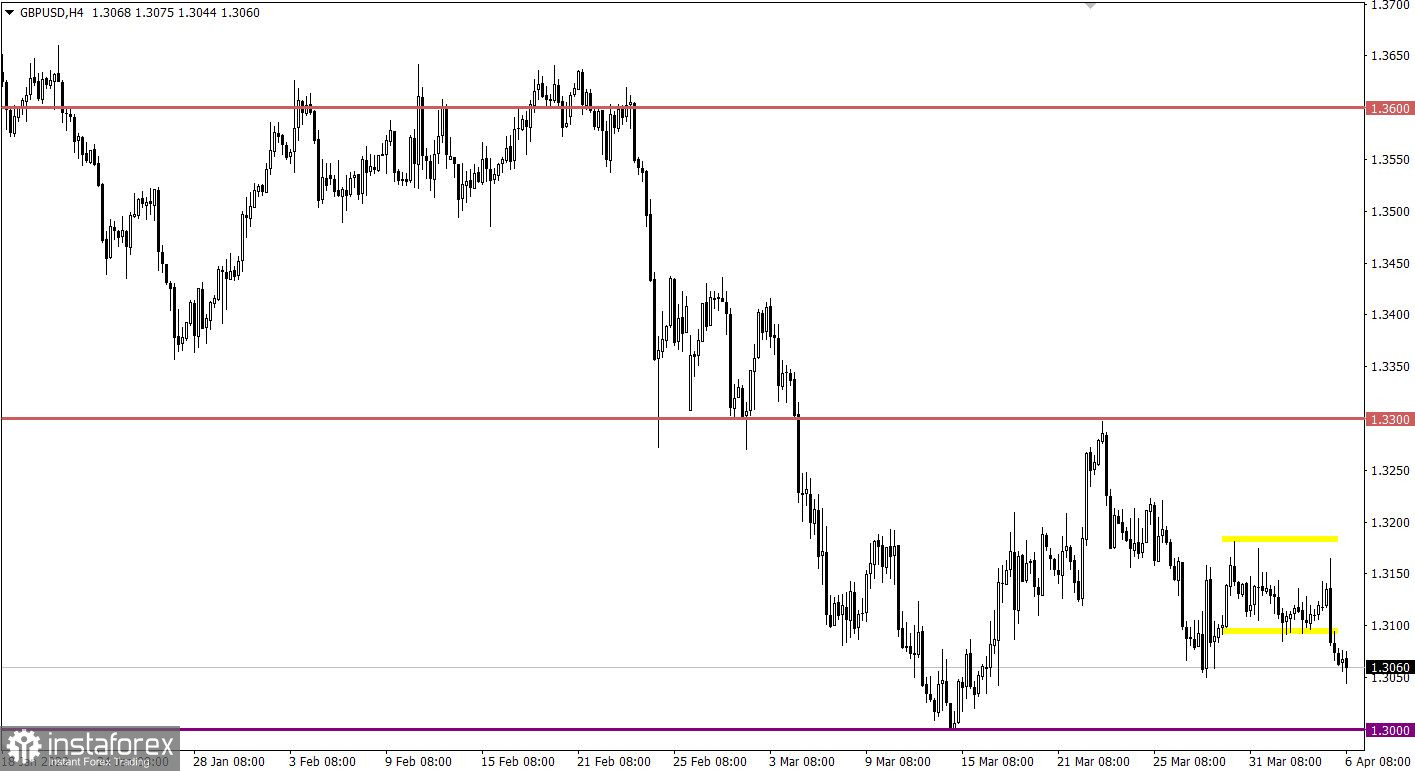
The long-playing side channel 1.3105/1.3180 for the GBPUSD pair was broken through a downward trajectory. This led to speculation in the market, where the pound sterling fell to the value area of 1.3060. In fact, there was another attempt by sellers to return the quote to the support level of 1.3000, winning back a 100% corrective move.

Today, data on the producer price index in the European Union is expected, which is predicted to grow further to 36% (YoY). During the American trading session, the minutes of the previous meeting of the Federal Open Market Committee (FOMC) will be published. Traders should pay attention to the comments of the regulator, as there may be details regarding the existing strategy to tighten monetary policy.
Time targeting
EU Producer Price Index - 09:00 UTC
FOMC Minutes - 18:00 UTC
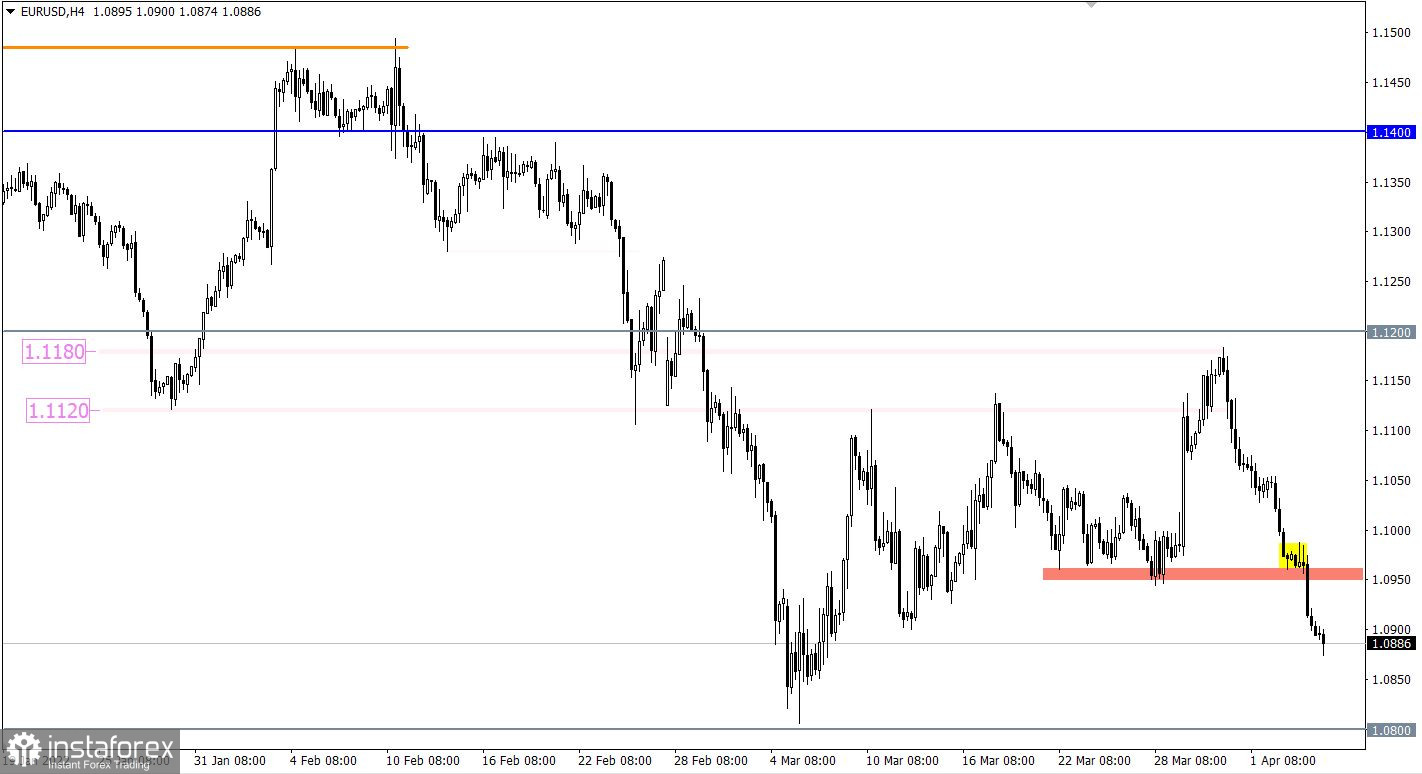
Despite the oversold status of the euro, there are still sellers on the market. Stable price retention below the value of 1.0900 may lead to further weakening of the euro towards the support level of 1.0800.
An alternative scenario for the development of the market considers a local pullback of the price from the value of 1.0900 to 1.0950. This step will lead to a regrouping of trading forces.
At the moment, the quote has slightly slowed down the downward movement, where the area of 1.3050/1.3060 serves as variable support. Keeping the price below these values is highly likely to lead to a further decline towards the 1.3000 support level. Until then, a rollback to the lower boundary of the passed flat is possible.
A candlestick chart view is graphical rectangles of white and black light, with sticks on top and bottom. When analyzing each candle in detail, you will see its characteristics of a relative period: the opening price, closing price, and maximum and minimum prices.
Horizontal levels are price coordinates, relative to which a stop or a price reversal may occur. These levels are called support and resistance in the market.
Circles and rectangles are highlighted examples where the price of the story unfolded. This color selection indicates horizontal lines that may put pressure on the quote in the future.
The up/down arrows are the reference points of the possible price direction in the future.
InstaForex analytical reviews will make you fully aware of market trends! Being an InstaForex client, you are provided with a large number of free services for efficient trading.


