 Zostať
Podmienky obchodovania
Nástroje


The UK labor market is doing quite well. The unemployment rate decreased from 3.9% to 3.8%, while employment in the country increased by 10,000 during February, and the number of claims for unemployment benefits decreased by 46,900.
Despite the positive statistics, the pound sterling did not react in any way.
During the American trading session, data on inflation in the United States were published, showing that the growth rate of consumer prices in March 2022 accelerated to 8.5% in annual terms, the highest since December 1981.
The figures suggest that it is worth waiting for tough measures from the Fed, which will direct all its efforts to curb prices.
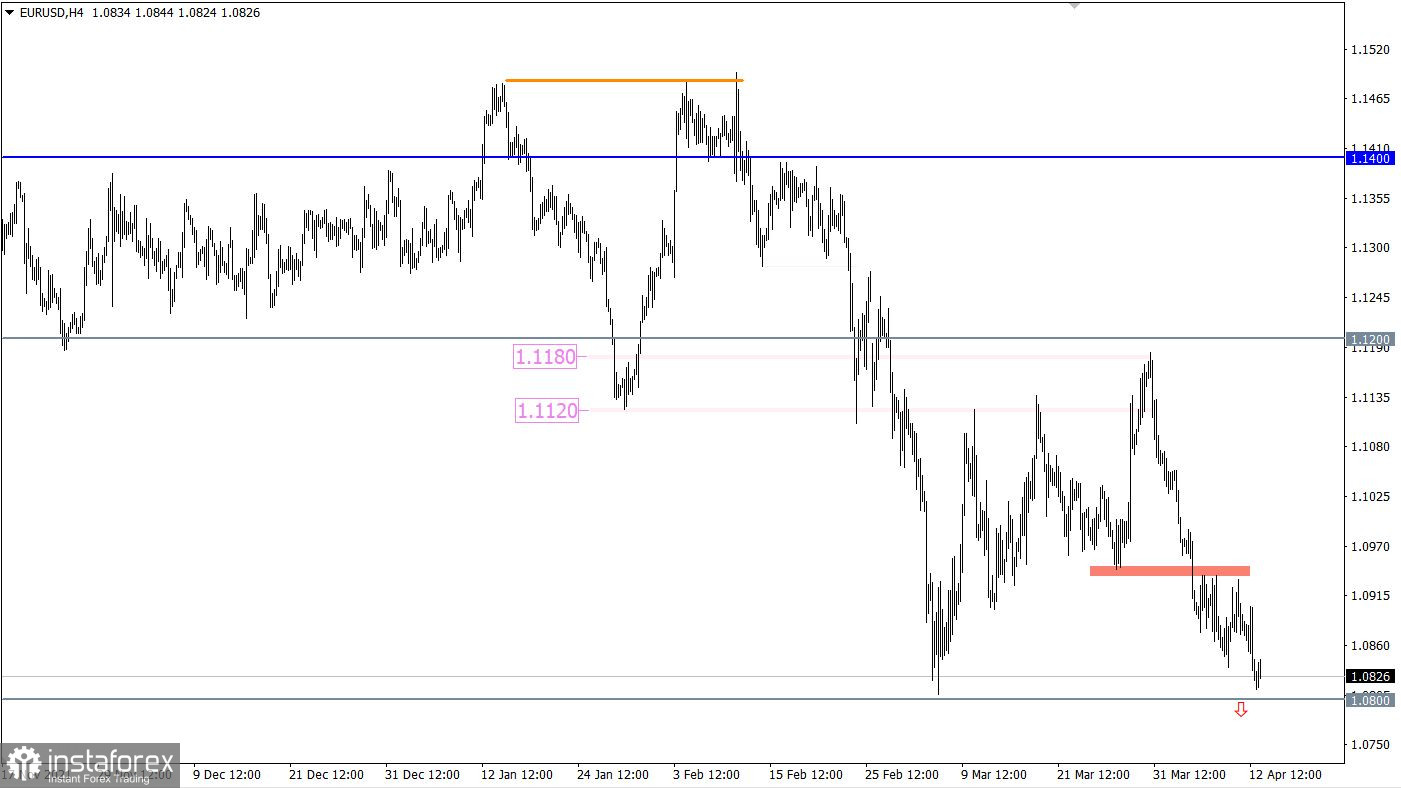
After a short pullback, the EURUSD pair resumed its decline. This led to a control convergence of the price with a pivot point of 1.0800. The gradual depreciation of the euro signals the upcoming breakdown of the support level, where there will be a prolongation of the medium-term downward trend.
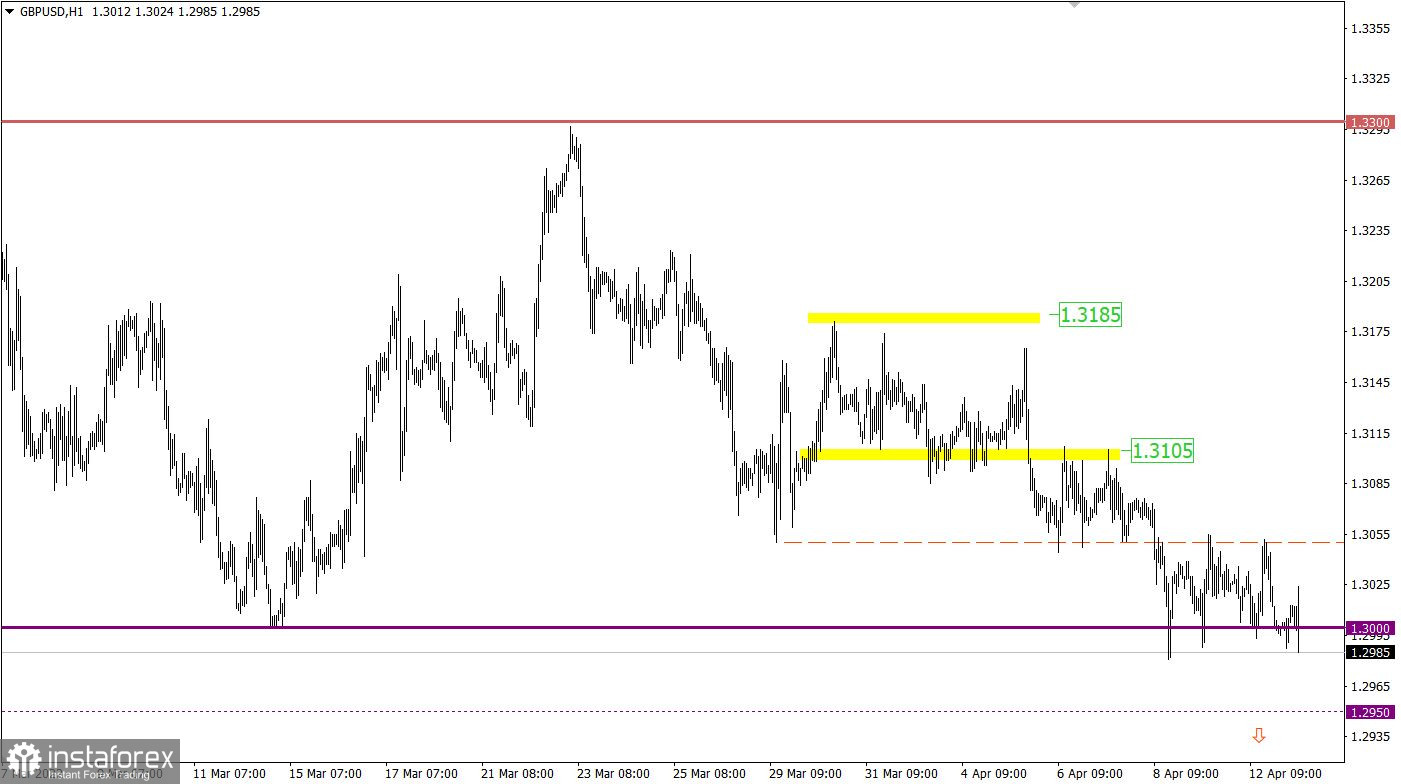
The GBPUSD currency pair has been moving within the psychological level of 1.3000 for the third day in a row, having a fairly narrow amplitude. This indicates the process of accumulation of trading forces, which may be a signal of the upcoming acceleration in the market.

Data on the UK inflation were published today, which saw an acceleration in consumer price growth from 6.2% to 7.0% with a forecast of 6.7%. Such high inflation is damaging the economy, which is a negative factor for the pound sterling.
During the American trading session, the producer price index in the United States will be published, which is expected to grow from 10.0% to 10.6%. Rising prices will lead to further inflation, which is already at historical levels.
All this is a negative factor for the US economy.
Time targeting
US producer price index - 12:30 UTC
In this situation, holding the price below the level of 1.0800 in a four-hour period will indicate a continuation of the trend. This may lead to a subsequent movement towards the local minimum of 2020.
An alternative scenario for the development of the market considers another slowdown in the downward move within 1.0800. This may lead to a temporary pullback, but not to a change in trading interests.
The price stagnation within the deviation of the 1.3000 level will soon end. With a high degree of probability, it will become a lever for speculators in the upcoming acceleration in the market. It is worth considering that the signal of prolongation of the downward trend will be confirmed only after the price is kept below the value of 1.2950 in a four-hour period.
As for the upward development of the price, traders consider this scenario as a local rebound of the price from the support level of 1.3000. The signal for action will come from the market at the moment the price is held above the value of 1.3055. In the future, this move may lead to the 1.3105 mark, after which a price reversal is not excluded.
A candlestick chart view is graphical rectangles of white and black light, with sticks on top and bottom. When analyzing each candle in detail, you will see its characteristics of a relative period: the opening price, closing price, and maximum and minimum prices.
Horizontal levels are price coordinates, relative to which a stop or a price reversal may occur. These levels are called support and resistance in the market.
Circles and rectangles are highlighted examples where the price of the story unfolded. This color selection indicates horizontal lines that may put pressure on the quote in the future.
The up/down arrows are the reference points of the possible price direction in the future.
InstaForex analytical reviews will make you fully aware of market trends! Being an InstaForex client, you are provided with a large number of free services for efficient trading.


