 Zostať
Podmienky obchodovania
Nástroje


The GBP/USD currency pair also continued its downward movement on Wednesday, but still not as strong as a few days before. Nevertheless, traders still managed to pull the pair to the level of 1.2493, which is 61.8% Fibonacci on the 24-hour TF. From our point of view, this is quite an important level and we are not even absolutely certain that the pair will be able to overcome it on the first attempt. Moreover, an upward correction has been brewing for several days. The pound's recent decline is easily explained due to the general fundamental background, but at the same time, it is quite difficult to explain why the fall was so sharp and strong. Rather, there are no explanations or any specific reasons. Yesterday, there was not a single important event in either the UK or the US, so the pair's movements are in no way related to the fundamental or macroeconomic background. There is also very little news on geopolitics.
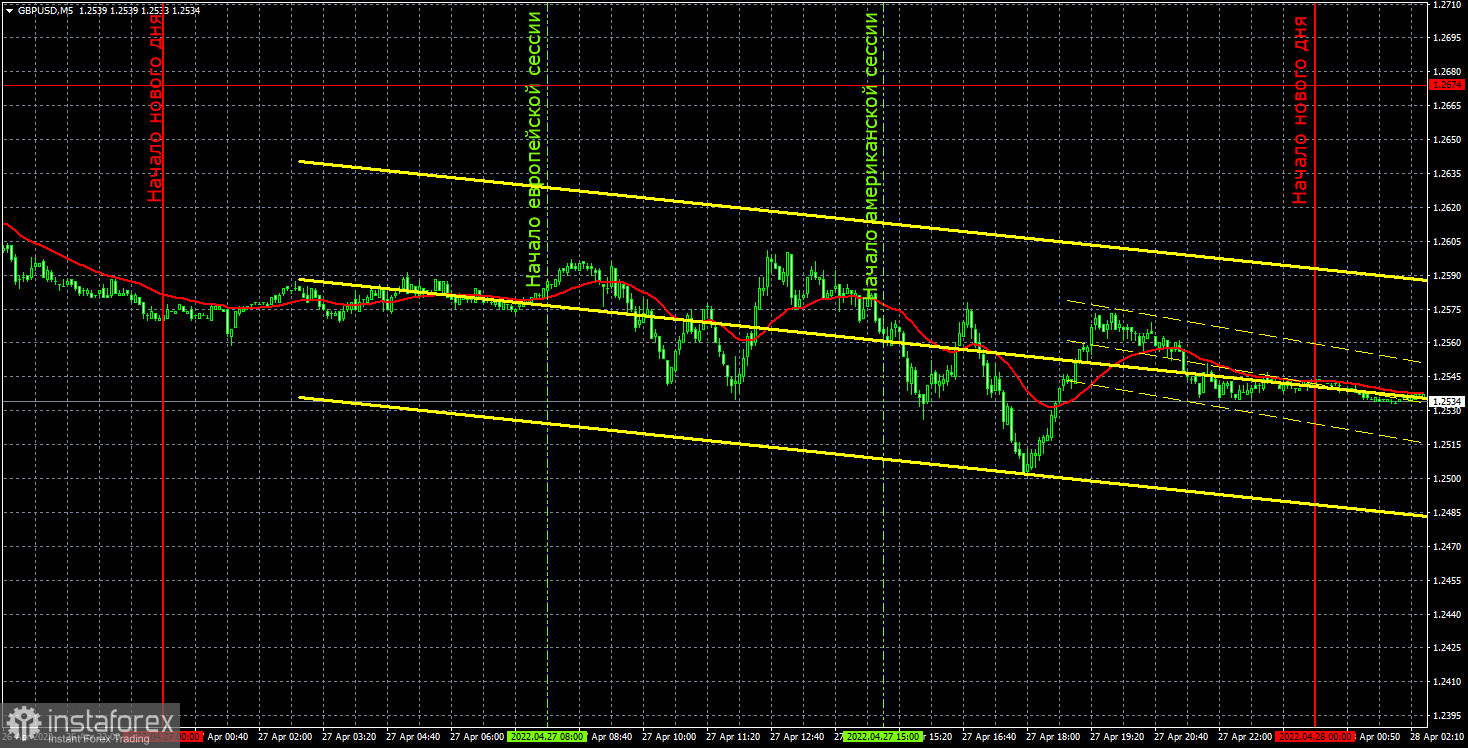
Not a single trading signal was formed on the 5-minute TF during the past day. This is due to the fact that the pair has not been at current price values for more than a year and a half, so there are simply no levels around which trading signals could be formed. The lines of the Ichimoku indicator are located much higher than the current price values. In general, you need to wait until the pair spends some time in this area to form extreme levels, which can then be traded.
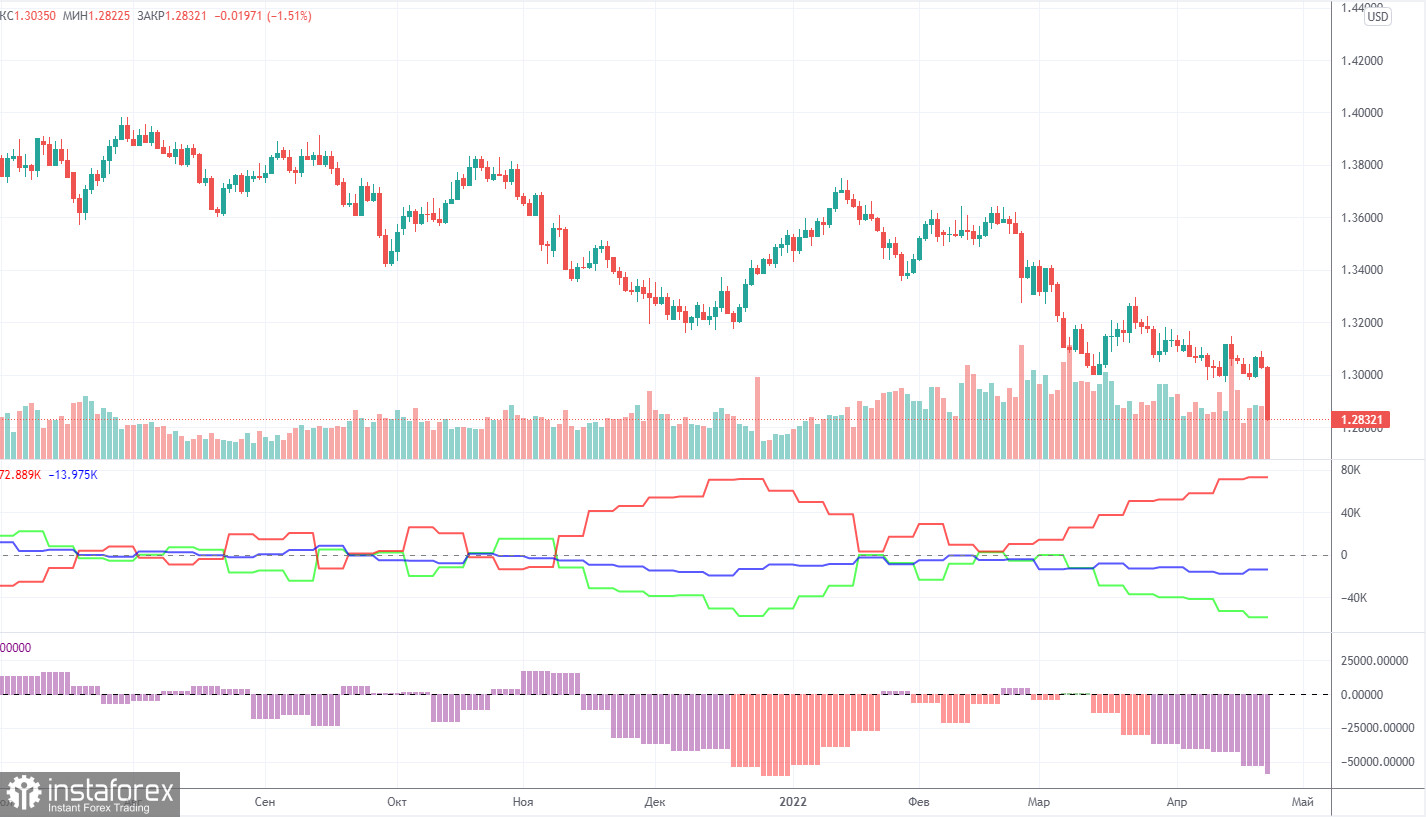
The latest Commitment of Traders (COT) report on the British pound has witnessed a new strengthening of the bearish mood among commercial traders. During the week, the non-commercial group opened 1,300 long positions and 7,100 short positions. Thus, the net position of non-commercial traders decreased by another 6,000. Such changes are significant for the pound. The non-commercial group has already opened a total of 95,700 short positions and only 36,800 long positions. Thus, the difference between these numbers is almost threefold. This means that the mood of commercial traders is now "pronounced bearish". Thus, this is another factor that speaks in favor of the continuation of the pound's decline. Note that in the pound's case, the COT report data very accurately reflects what is happening in the market. According to the pound, the mood of the major players changes every couple of months, but at this time it fully corresponds to the movement of the pound/dollar pair. The net position of the "non-commercial" group has already fallen to the levels where the last round of the pound's fall ended (the green line on the first indicator). Thus, we can even assume that in the coming weeks the pound will try to start a new ascent. However, the current fundamental and geopolitical background does not give good reasons to expect a strong growth of the British currency.
Overview of the EUR/USD pair. April 28. There will be no truce between Ukraine and Russia. Europe needs to learn to live in new realities.
Overview of the GBP/USD pair. April 28. The American Lend-Lease program has been practically adopted. Arms supplies to Ukraine will increase many times.
Forecast and trading signals for EUR/USD on April 28. Detailed analysis of the movement of the pair and trading transactions.
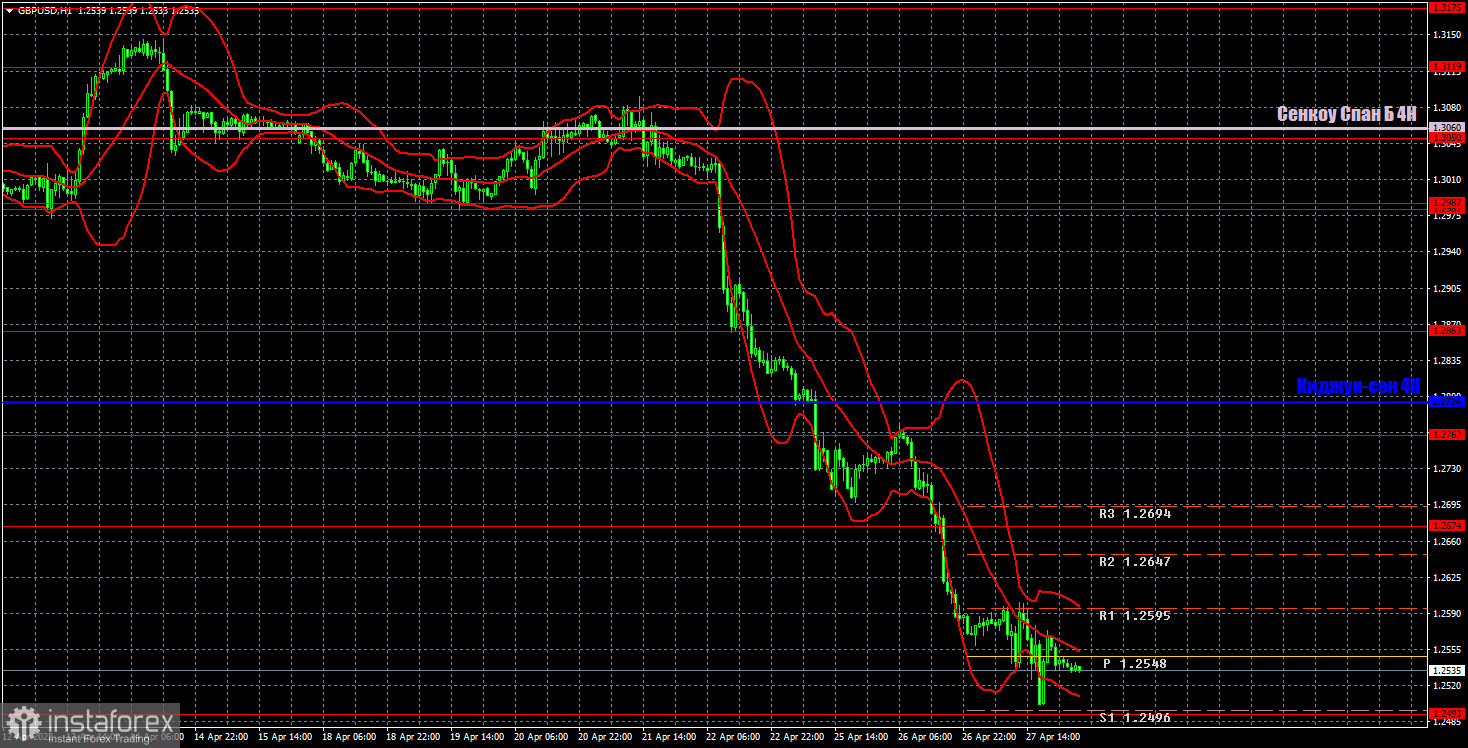
The hourly timeframe clearly shows how much the pound has fallen in the last four days. However, very soon all the downward movement will no longer fit into the chart without changing the scale. We believe that an upward correction may begin from the 1.2493 level. Or maybe even a new upward trend, since the last drop by 500 points looks like the final chord. All the factors that negatively affected the pound have already been worked out by the market. Perhaps it's time for the pound to go up. Although, if geopolitics continues to deteriorate, the British currency is likely to fly further to the downside. We highlight the following important levels on April 28: 1.2251, 1.2493, 1.2674, 1.2762, 1.2863. The Senkou Span B (1.3060) and Kijun-sen (1.2794) lines can also be signal sources. Signals can be "bounces" and "breakthroughs" of these levels and lines. It is recommended to set the Stop Loss level to breakeven when the price passes in the right direction by 20 points. The lines of the Ichimoku indicator can move during the day, which should be taken into account when determining trading signals. There are also support and resistance levels on the chart that can be used to take profits on transactions. There are no important events and reports scheduled for Thursday in the UK. The GDP for the first quarter will be released in America, which may provoke a market reaction. However, the British pound is happy to fall every day even without macroeconomics, and traders are actively trading the pair.
Support and Resistance Levels are the levels that serve as targets when buying or selling the pair. You can place Take Profit near these levels.
Kijun-sen and Senkou Span B lines are lines of the Ichimoku indicator transferred to the hourly timeframe from the 4-hour one.
Support and resistance areas are areas from which the price has repeatedly rebounded off.
Yellow lines are trend lines, trend channels and any other technical patterns.
Indicator 1 on the COT charts is the size of the net position of each category of traders.
Indicator 2 on the COT charts is the size of the net position for the non-commercial group.
InstaForex analytical reviews will make you fully aware of market trends! Being an InstaForex client, you are provided with a large number of free services for efficient trading.

