 Zostať
Podmienky obchodovania
Nástroje


Weekly data on jobless claims in the United States was published, where figures rose more than estimates. This is a negative factor for the labor market.
Statistics details:
The volume of continuing claims for benefits rose from 1.650 million to 1.688 million.
The volume of initial claims for benefits rose from 183,000 to 196,000.
The U.S. dollar reacted by weakening against the euro and the pound sterling.
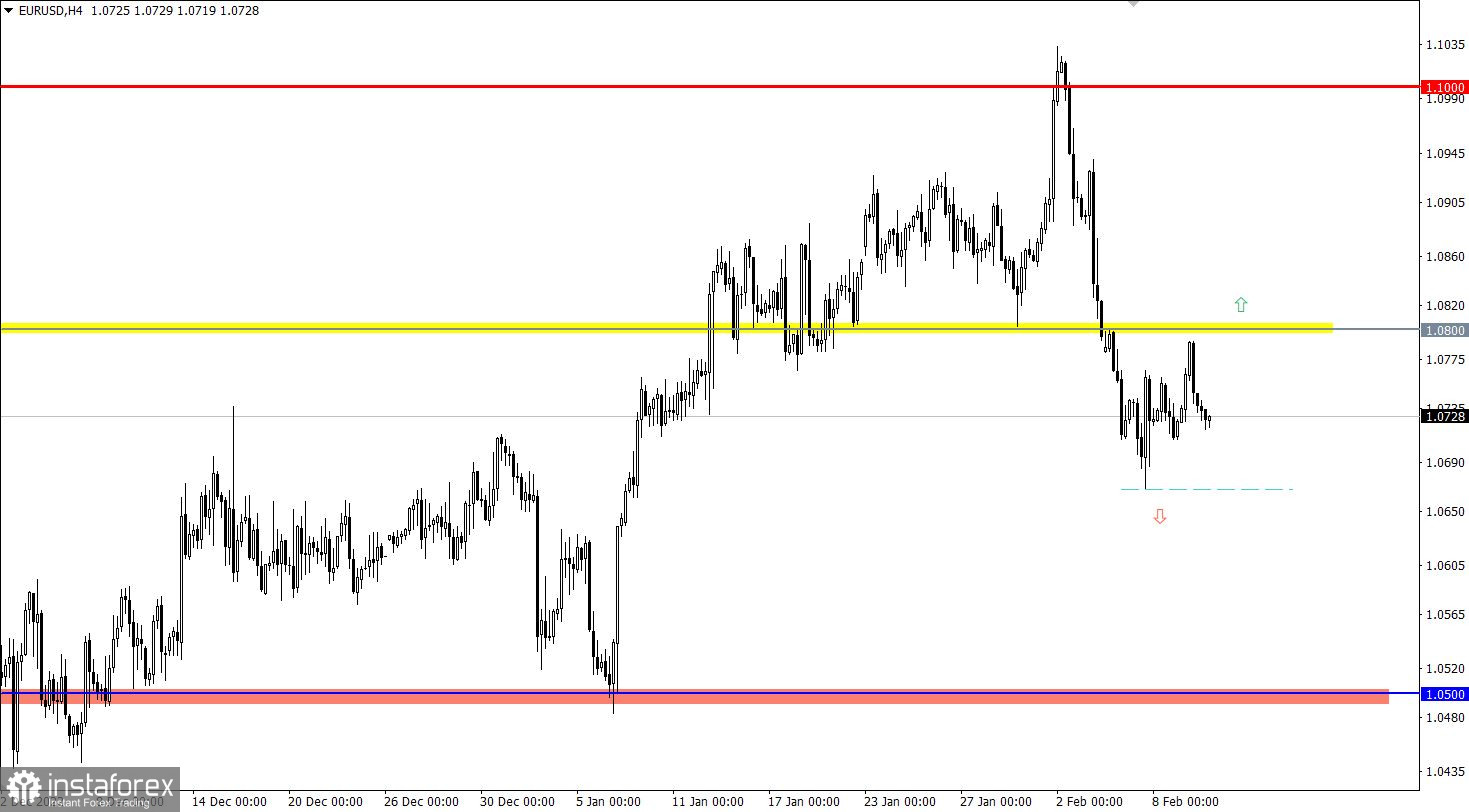
The EURUSD currency pair slightly deviated from the lateral amplitude, but this did not lead to anything cardinal. The 1.0800 control level was not touched by the buyers, as a result, a reverse move occurred, which returned the quote to its previous values.
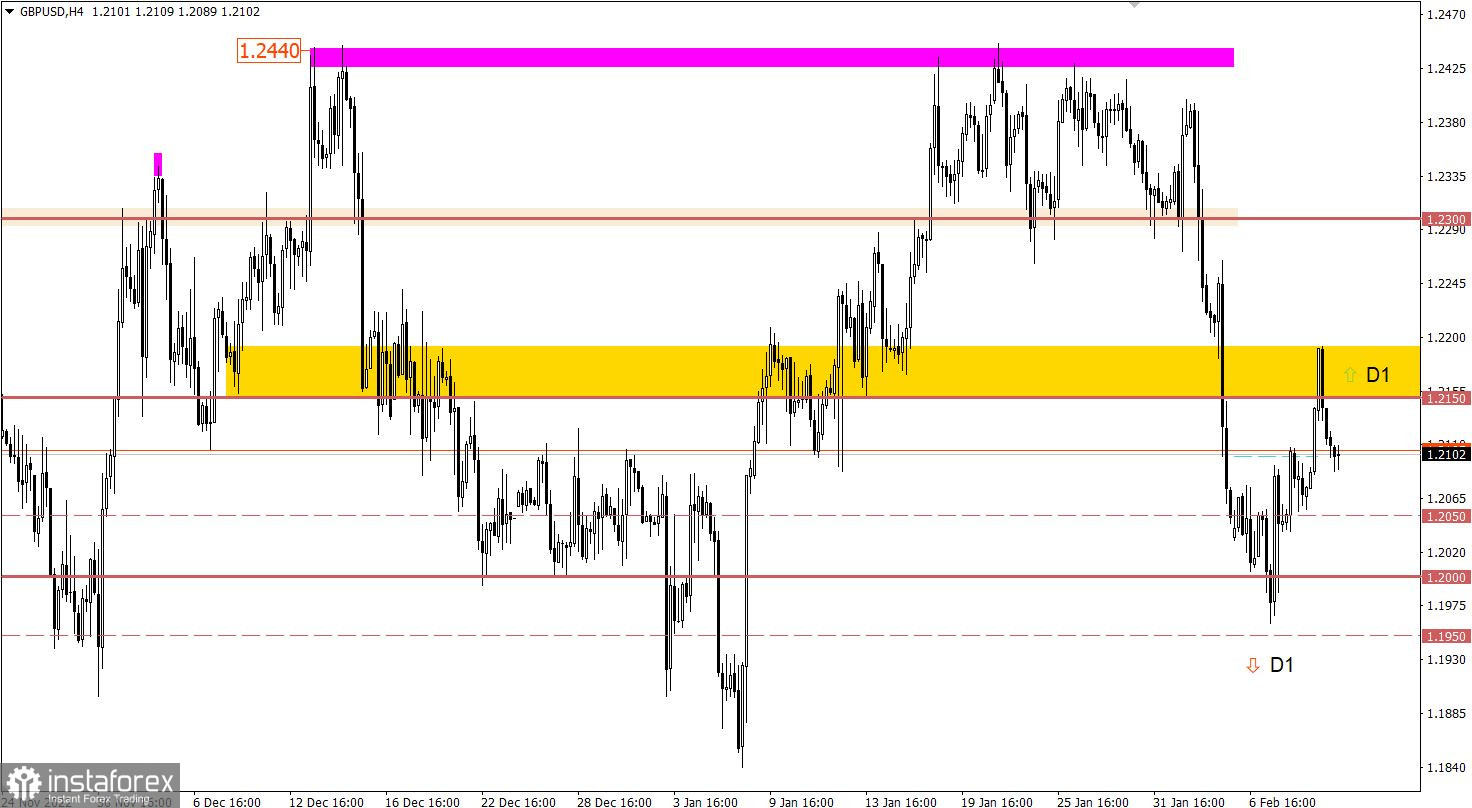
The GBPUSD currency pair showed high activity yesterday, during which the quote at the beginning rushed up by about 120 points and then rolled back almost the same volume. The local growth of long positions led to a jump in prices above the level of 1.2150, but the pound sterling failed to hold on to new values.

At the opening of the European session, data on UK GDP for the fourth quarter were published, which reflected a slowdown in economic growth from 1.9% to 0.4%. Despite the fact that the indicators came out a little better than the forecast, we are still seeing a strong slowdown.
In this situation, much will depend on whether the quote will eventually manage to leave the stagnation, as the following scenario will be clear from that.
There are two main scenarios: first, a prolonged correction in case the price stays below 1.0660, as well as the completion of the correction stage and the transition to the recovery process of the euro. In the second scenario, the quote needs to stay above the level of 1.0800 for at least a four-hour period.
In this situation, there is no clear technical signal about the resumption of the correction, but everything can change if the quote returns below 1.2050. In this case, the 1.2000 psychological level will again be hit by sellers, which may eventually lead to its breakdown. The main signal about the growth of the volume of short positions in the pound sterling will appear at the moment the price is kept below the value of 1.1950.
The alternative scenario considers a variable turbulence where the 1.2000 level area has slowed down the sellers, which will lead to an amplitude of 1.2000/1.2100.
The candlestick chart type is white and black graphic rectangles with lines above and below. With a detailed analysis of each individual candle, you can see its characteristics relative to a particular time frame: opening price, closing price, intraday high and low.
Horizontal levels are price coordinates, relative to which a price may stop or reverse its trajectory. In the market, these levels are called support and resistance.
Circles and rectangles are highlighted examples where the price reversed in history. This color highlighting indicates horizontal lines that may put pressure on the asset's price in the future.
The up/down arrows are landmarks of the possible price direction in the future.
InstaForex analytical reviews will make you fully aware of market trends! Being an InstaForex client, you are provided with a large number of free services for efficient trading.

