 Zostať
Podmienky obchodovania
Nástroje


Markets paid attention to the publication of business activity indices in the manufacturing sector in Europe, the United Kingdom, and the United States.
Details of PMI statistics:
Eurozone manufacturing PMI fell from 48.5 to 47.3 in March, with a forecast decline to 47.1.
The UK manufacturing PMI fell to 47.9 from 49.3, compared to a forecast of 48.0.
U.S. manufacturing PMI fell from 47.3 to 49.2.
Although the data was bad across the board, it did not diverge much from the preliminary estimate.
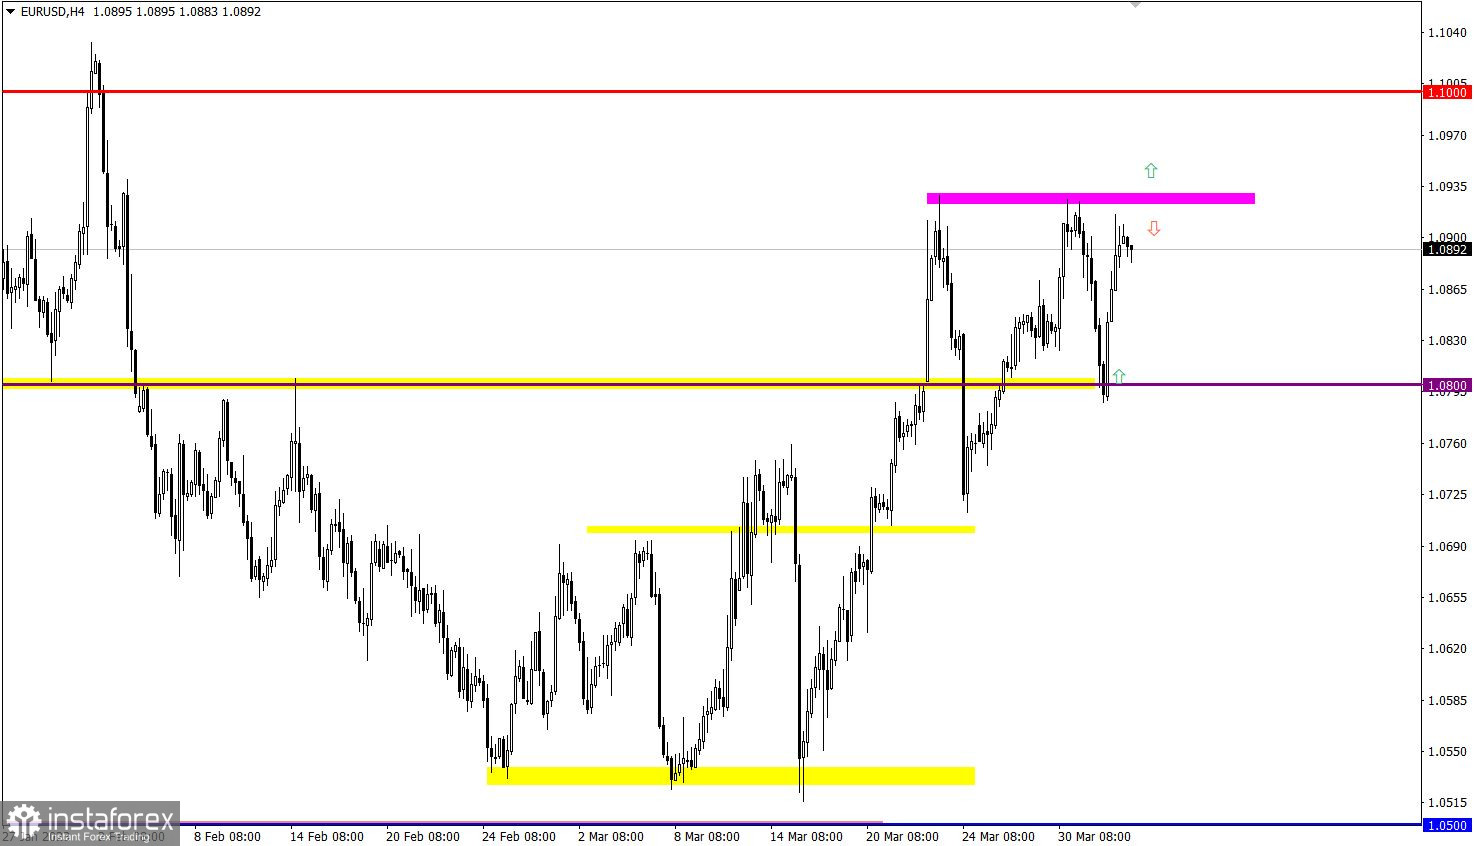
EUR/USD ended its downward trend at 1.0800, which caused an increase in long positions. This growth provided the basis for the rebound, which allowed the euro to recover its value after the recent slump.
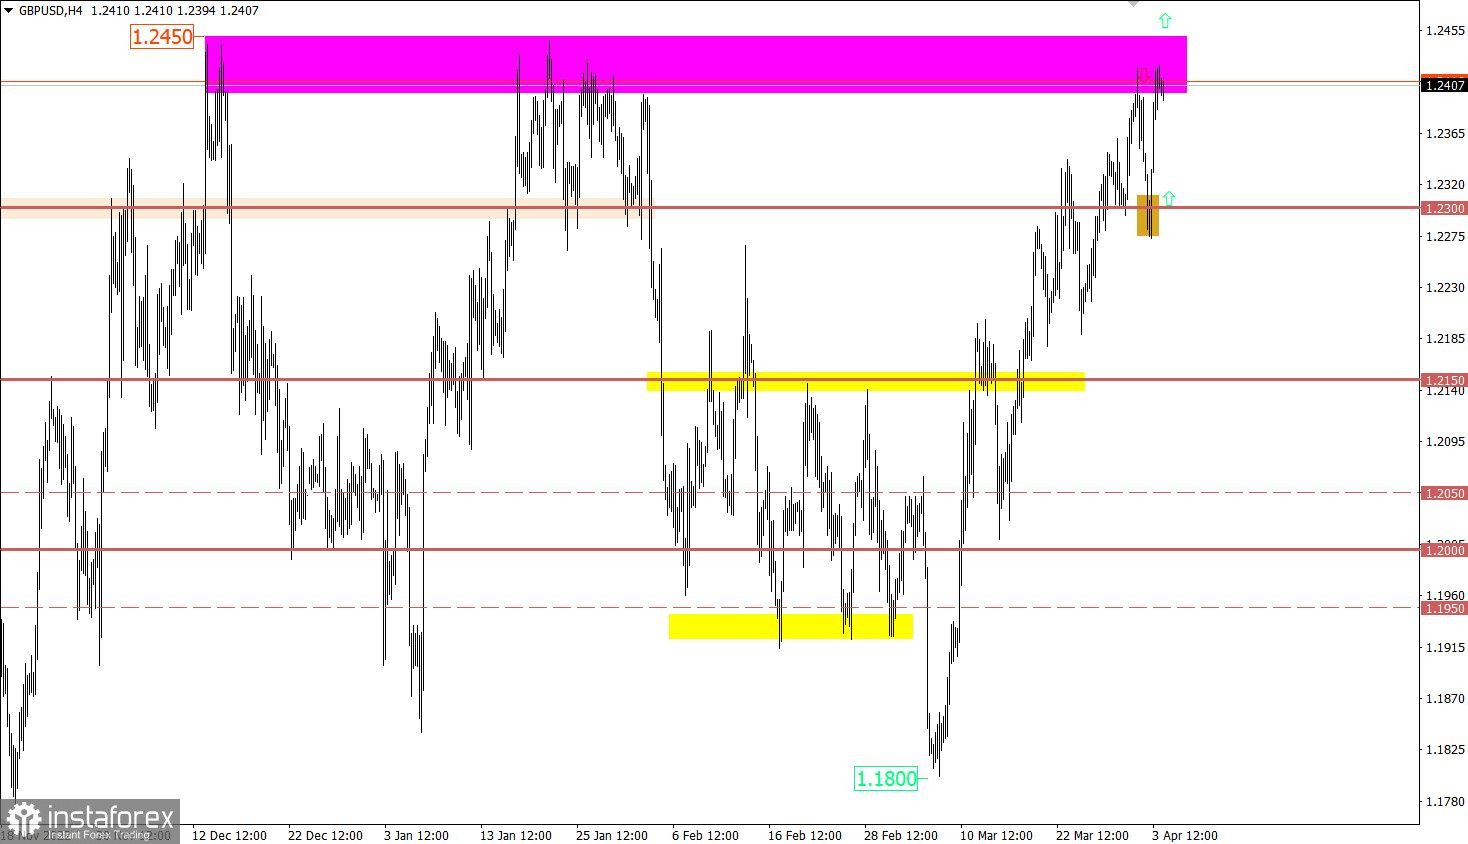
GBP/USD also regained its value after the recent slump and reached the local high of the previous week. The growth of long positions took place around 1.2300, which served as a support for this recovery.
Today we should pay attention to the producer price index in the EU. Economists predict its decline from 15.0% to 13.3% (YoY). If the forecasts come true and the index declines, this may have a negative impact on the euro exchange rate, creating pressure for its fall. However, if the data turns out to be better than expected and the index drops less than predicted, this may cause a backlash in the market.
During the American trading session, Labor Department's Job Openings and Labor Turnover Survey (JOLTS) report for February will be published, where the number of vacancies is estimated to decrease.
Time targeting:
EU Producer Price Index – 09:00 UTC
U.S. Job Openings and Labor Turnover Survey (JOLTS) – 10:00 UTC
The 1.0930 level acts as a resistance in the way of buyers and has repeatedly put pressure on long positions. Based on the previous patterns associated with this level, traders consider a scenario of price rebound followed by an increase in the volume of short positions. However, a stable holding of the price above 1.0930 will lead to an extension of the upward cycle.
Focusing on the mood of the buyers, we can assume that a stable price retention above 1.2450 may lead to the continuation of the medium-term upward trend. However, we should be very careful in our actions because the level of 1.2400/1.2450 has repeatedly acted as resistance in the market.
The candlestick chart type is white and black graphic rectangles with lines above and below. With a detailed analysis of each individual candle, you can see its characteristics relative to a particular time frame: opening price, closing price, intraday high and low.
Horizontal levels are price coordinates, relative to which a price may stop or reverse its trajectory. In the market, these levels are called support and resistance.
Circles and rectangles are highlighted examples where the price reversed in history. This color highlighting indicates horizontal lines that may put pressure on the asset's price in the future.
The up/down arrows are landmarks of the possible price direction in the future.
InstaForex analytical reviews will make you fully aware of market trends! Being an InstaForex client, you are provided with a large number of free services for efficient trading.

