 Zostať
Podmienky obchodovania
Nástroje


Yesterday, final business activity figures were published for the eurozone, the United Kingdom, and the United States. In the eurozone, the services PMI rose to 55.0 from 52.7, and the composite index increased to 53.7 from 52.0. Economists had expected growth of 54.1. In the United Kingdom, business activity in the services sector fell to 52.9 from 53.5, and the composite index dropped to 52.2 from 53.1. In the United States, the services PMI accelerated to 52.6 from 50.6, less than the expected 53.8. The composite index advanced to 52.3 from 50.1.
The United States published data on ADP employment change, which revealed an increase of just 145,000 in March, which may indicate a possible slowdown in economic growth or a recession in the United States. Economists had forecasted figures to rise by 210,000, while growth in the previous reporting period was 261,000.
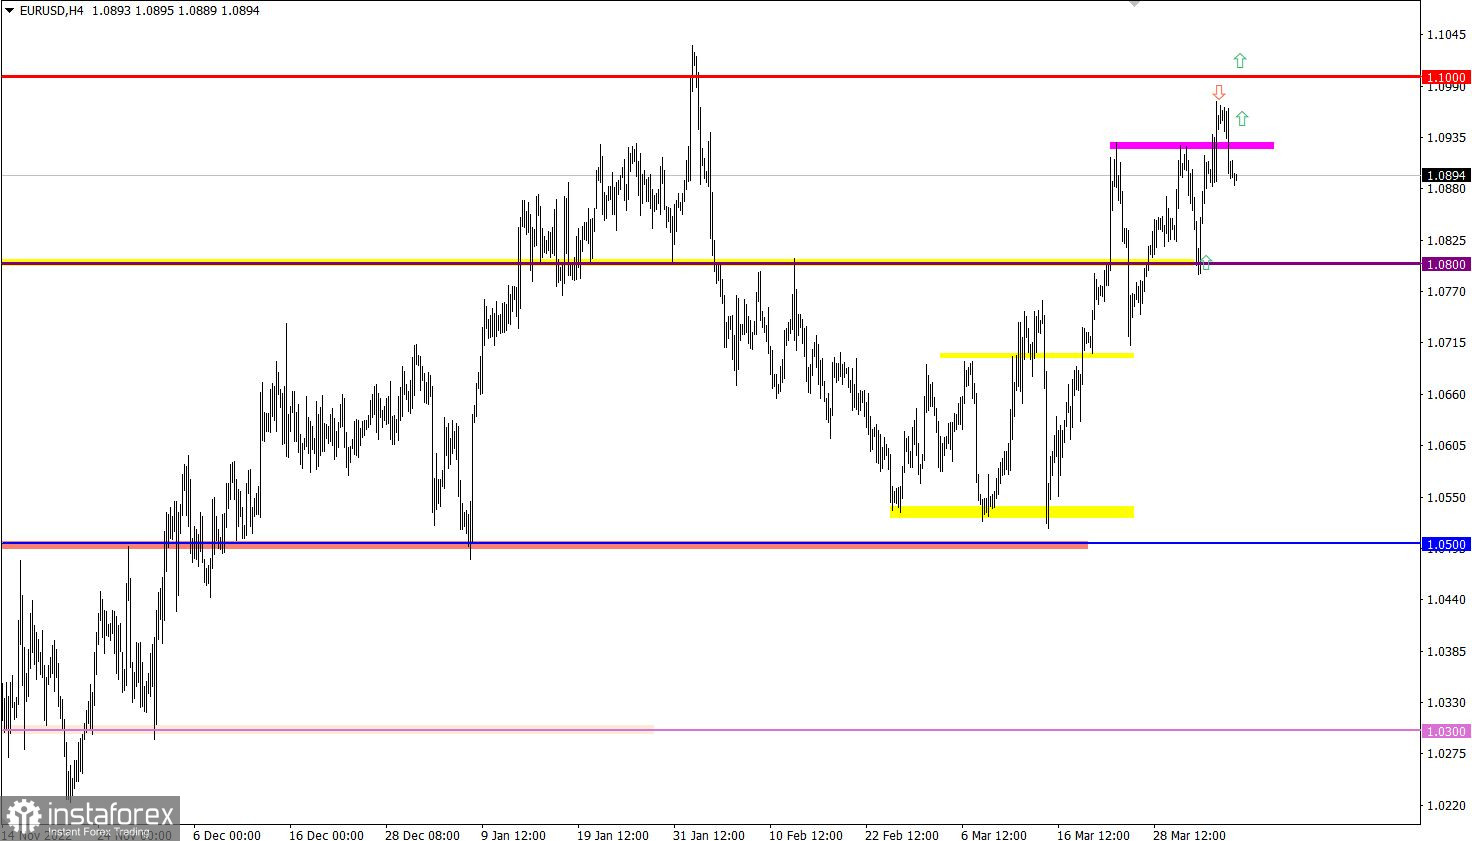
The euro/dollar pair is in a retracement phase after reaching a weekly swing high. As a result, the quotes dropped below the 1.0900 level, but the upward trend persists in the market.
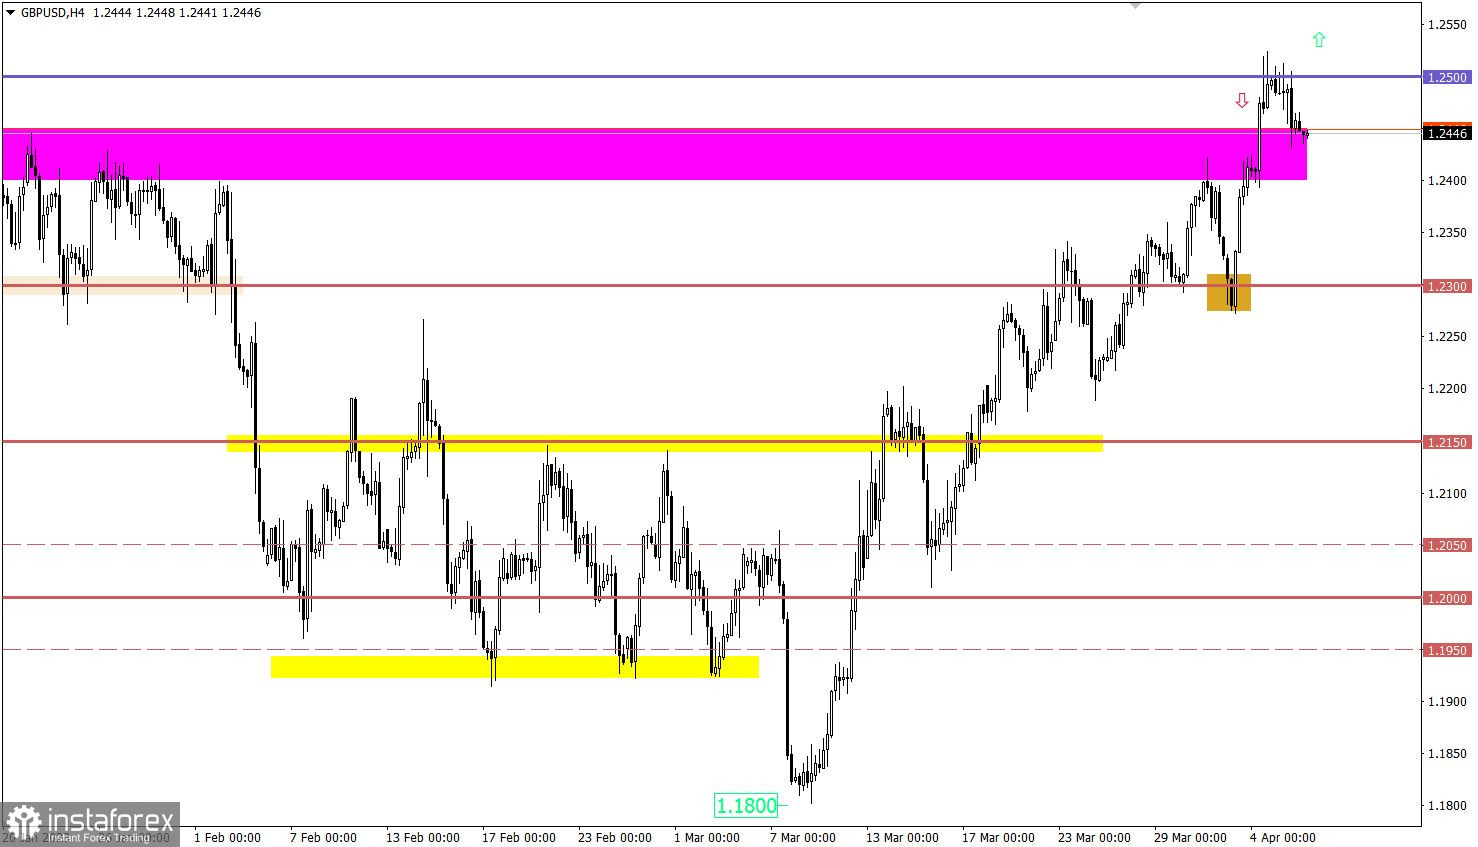
The pound/dollar pair recently reached the swing high of the medium-term upward trend. As a result, the quotes temporarily went above the 1.2500 mark, but due to an overbought signal, they entered a retracement phase.

Buyers face significant resistance near the psychologically important level of 1.1000, which leads to a reduction in the volume of long positions. However, the current retracement may shift trading forces, which will positively affect the overall trend. It is expected that the volume of long positions will increase after the price returns above the 1.0950 mark, targeting the 1.1000 level. The retracement phase continues for now.
The 1.2500 level serves as resistance for buyers and was reached by the price, A retracement occurred in the market afterward. Such a retracement may trigger a shift in trading forces. In case the price returns above the 1.2500 level, it will become possible to buy the pound sterling. However, as long as the quote is in the retracement phase, holding the price above the control level will be challenging.
The candlestick chart shows graphical white and black rectangles with upward and downward lines. While conducting a detailed analysis of each individual candlestick, it is possible to notice its features intrinsic to a particular time frame: the opening price, the closing price, and the highest and lowest price.
Horizontal levels are price levels, in relation to which a stop or reversal of the price may occur. They are called support and resistance levels.
Circles and rectangles are highlighted examples where the price reversed in the course of its history. This color highlighting indicates horizontal lines which can exert pressure on prices in the future.
Upward/downward arrows signal a possible future price direction.
InstaForex analytical reviews will make you fully aware of market trends! Being an InstaForex client, you are provided with a large number of free services for efficient trading.

