 Zostať
Podmienky obchodovania
Nástroje


On Monday, the EUR/USD pair showed volatility equal to 45 points. This is quite a common occurrence for a Monday, in which the pair is practically immobile, so this doesn't surprise us at all. The euro tried to enter a correction, but it didn't really succeed. Recall that the euro fell for the entirety of last week, which may indicate the start of a new downtrend, which we've long been waiting for. On the 1H chart, the price is below the Ichimoku indicator lines, as well as below the downward trend line. Therefore, I expect the euro to fall this week regardless of the fundamental and macroeconomic background. I believe that the euro has already worked out all the growth factors.
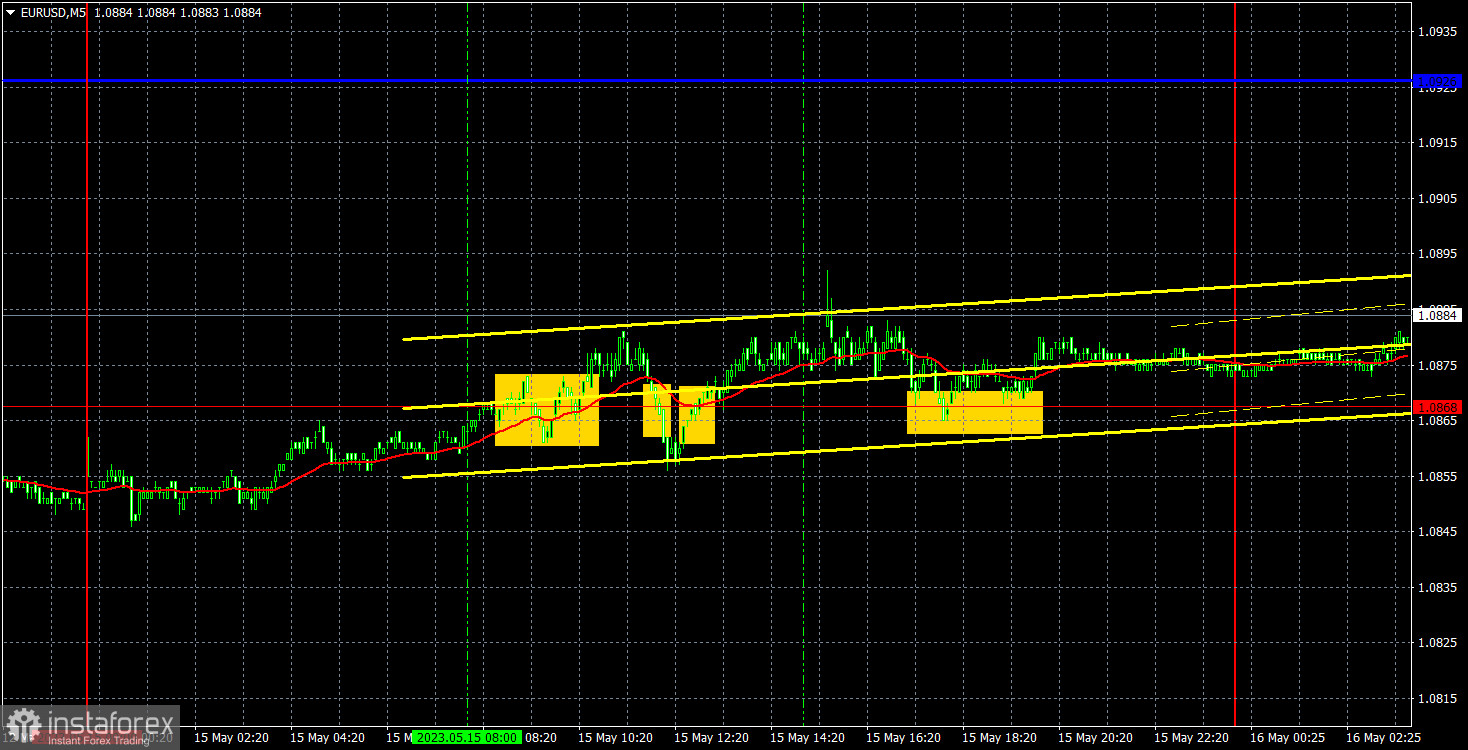
Speaking of trading signals, they were far from ideal. Traders could've gotten lucky if the price did not encounter any of the levels or lines on its way. But in practice, it was near 1.0868 all day, which it regularly crosses. Therefore, there were plenty of false signals. Traders could only work out the first two. In neither the first nor the second case, the pair could not go in the right direction even 15 points, so a small loss was received on both positions. There was only one report yesterday - industrial production in the European Union, which fell by 4.1% in March, which is much worse than forecasts. However, traders paid almost no attention to this report. The reaction, if any, was 10-15 points, no more.
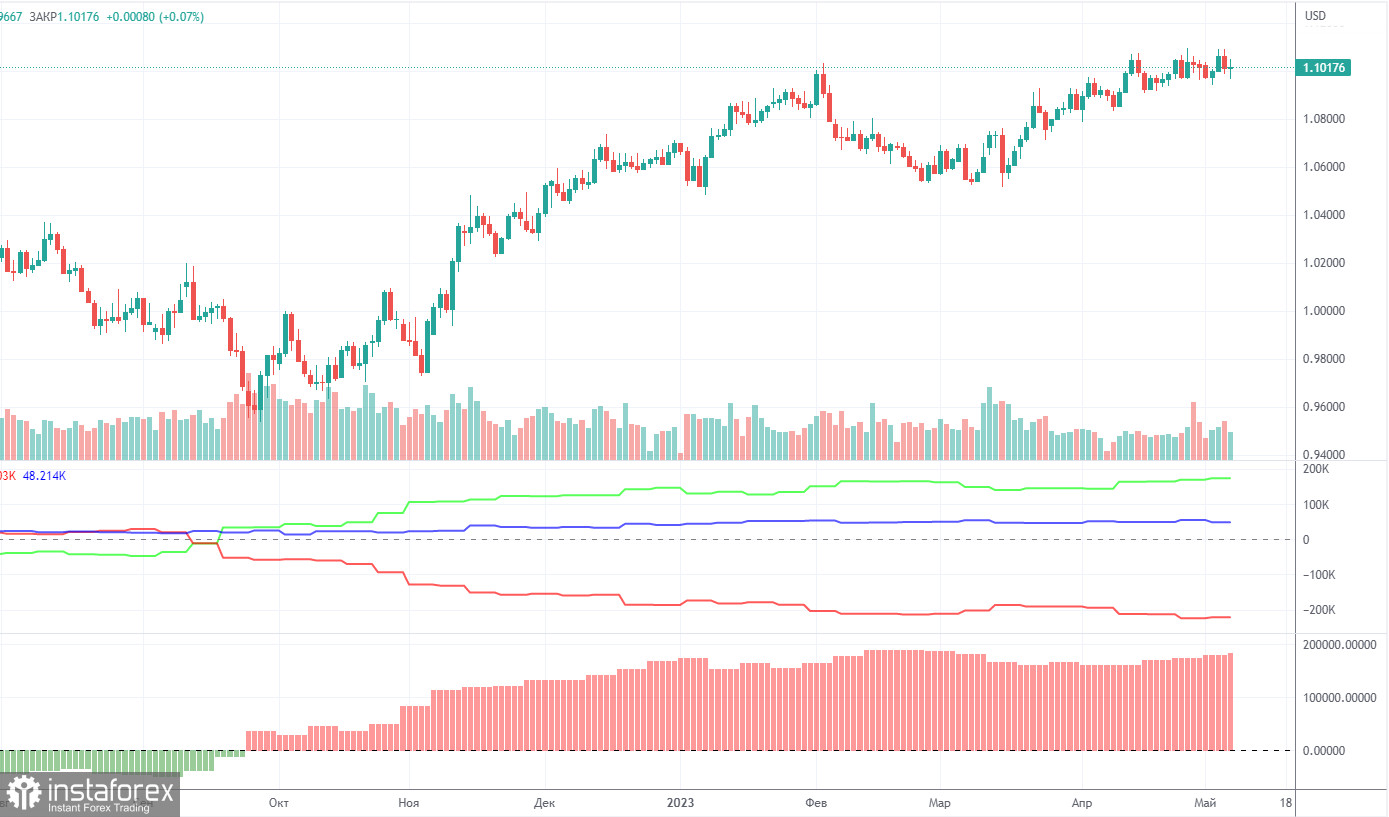
A new COT report for May 9 was released on Friday. In the last 9 months, the data of COT reports fully corresponded to what was happening in the market. The illustration above clearly shows that the net position of large market players (second indicator) began to grow in September 2022. Around the same time, the European currency also began to appreciate. Currently, the net position of the non-commercial group of traders remains bullish and so does the position of the European currency, which is hesitating to develop a proper downward correction.
We have previously drawn your attention to the fact that a relatively high net position value suggests a possible end of the uptrend. This is signaled by the first indicator where the red and green lines have moved significantly away from each other, which often precedes the end of a trend. The European currency attempted to start a decline, but we only saw a simple pullback. During the last reporting week, the number of long positions from the non-commercial group increased by 13,500, and the number of shorts by 7,500. Accordingly, the net position grew again, by 6,000. The number of longs is higher than the number of shorts among non-commercial traders by 180,000, which is very significant. The difference is almost threefold. A correction is still overdue, so even without COT reports, it is clear that the pair should start falling.
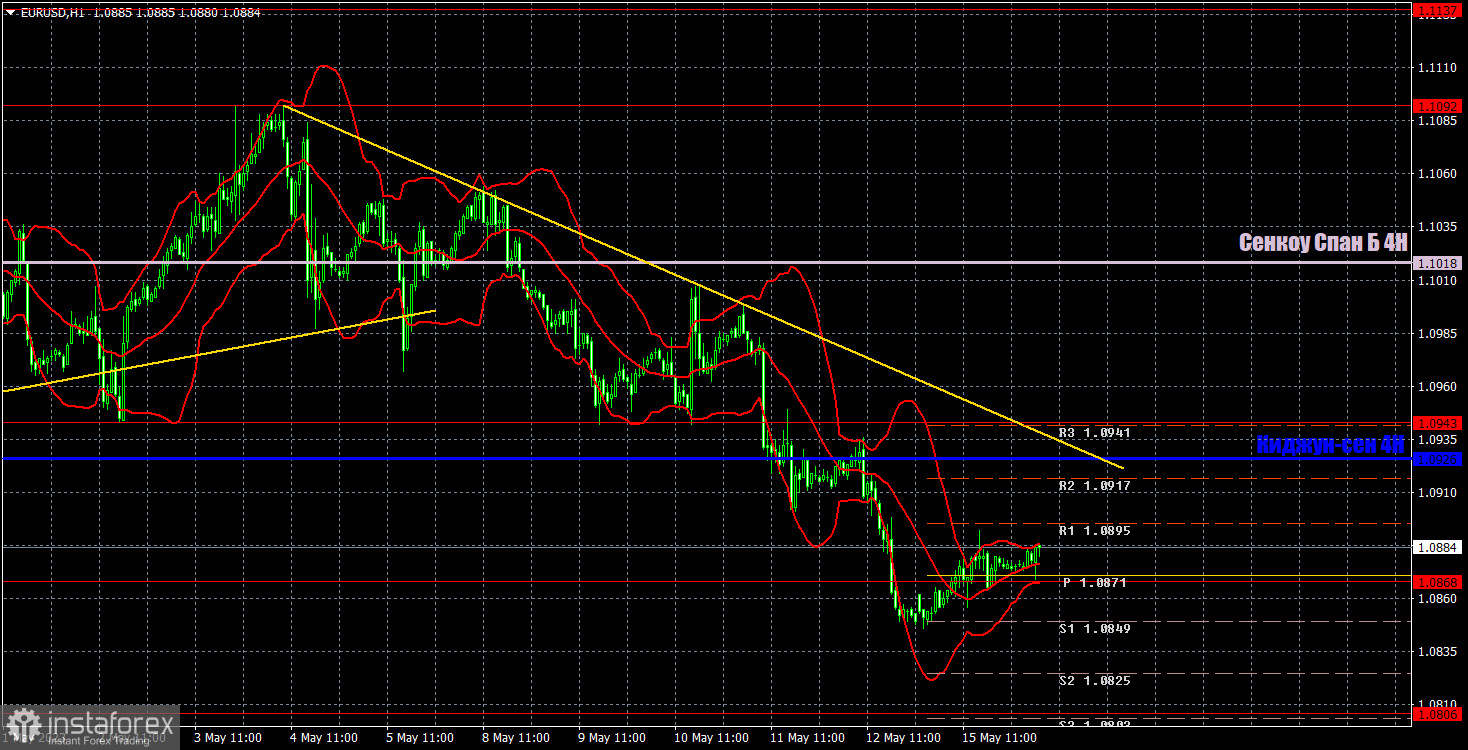
On the 1-hour chart, the pair extends its downward movement, which is now supported by the trend line. For the first time in a long time, the US dollar may show significant strengthening, as it remains heavily oversold. All technical indicators indicate a downtrend, and the fundamental and macroeconomic background should not support the euro in the coming weeks' perspective.
On Tuesday, important levels are seen at 1.0762, 1.0806, 1.0868, 1.0943, 1.1092, 1.1137-1.1185, 1.1234, as well as the Senkou Span B lines (1.1018) and Kijun-sen (1.0926) lines. Ichimoku indicator lines can move intraday, which should be taken into account when determining trading signals. There are also support and resistance although no signals are made near these levels. They could be made when the price either breaks or rebounds from these extreme levels. Do not forget to place Stop Loss at the breakeven point when the price goes by 15 pips in the right direction. In case of a false breakout, it could save you from possible losses.
On May 16 in the European Union, a report on GDP for the first quarter in the second assessment will be published, in Germany - the ZEW Economic Sentiment Index, and in the US - retail sales and industrial production. All these reports taken together should provoke some reaction, but each of them separately is unlikely to cause a strong movement of the pair. Also in the US, several representatives of the Federal Reserve will speak, which may also be interesting, but is also unlikely to provoke a strong reaction. In any case, today's movements should be stronger.
Resistance/support - thick red lines, near which the trend may stop. They do not make trading signals.
Kijun-sen and Senkou Span B are the Ichimoku indicator lines moved to the hourly timeframe from the 4-hour timeframe. They are also strong lines.
Extreme levels are thin red lines, from which the price used to bounce earlier. They can produce trading signals.
Yellow lines are trend lines, trend channels, and any other technical patterns.
Indicator 1 on the COT chart is the size of the net position of each trader category.
Indicator 2 on the COT chart is the size of the net position for the Non-commercial group of traders.
InstaForex analytical reviews will make you fully aware of market trends! Being an InstaForex client, you are provided with a large number of free services for efficient trading.


