 Zostať
Podmienky obchodovania
Nástroje


Inflation in the eurozone in April 2023 was 7.0%, 0.1% higher than in March. Last year, this figure reached 7.4%. Across the European Union, inflation in April was 8.1%, 0.2% lower than in March, matching last year's level.
The European economy continues to demonstrate resilience in difficult global conditions. Low energy prices, eased supply restrictions, and a strong labor market contributed to moderate growth in the first quarter of 2023, allaying fears of a recession. Consequently, the economic forecast for the EU for 2023 was revised upwards to 1.0% (compared to 0.8% in the winter forecast) and for 2024 to 1.7% (versus 1.6% in winter). Meanwhile, inflation was also revised upwards compared to winter, to 5.8% in 2023 and 2.8% in 2024 in the eurozone.
Due to high inflation, financing conditions will most likely tighten. Despite expectations that the ECB and other EU central banks will soon end the interest rate hike cycle, recent turbulence in the financial sector may increase pressure on the cost and availability of credit, slowing investment growth, particularly in residential construction.

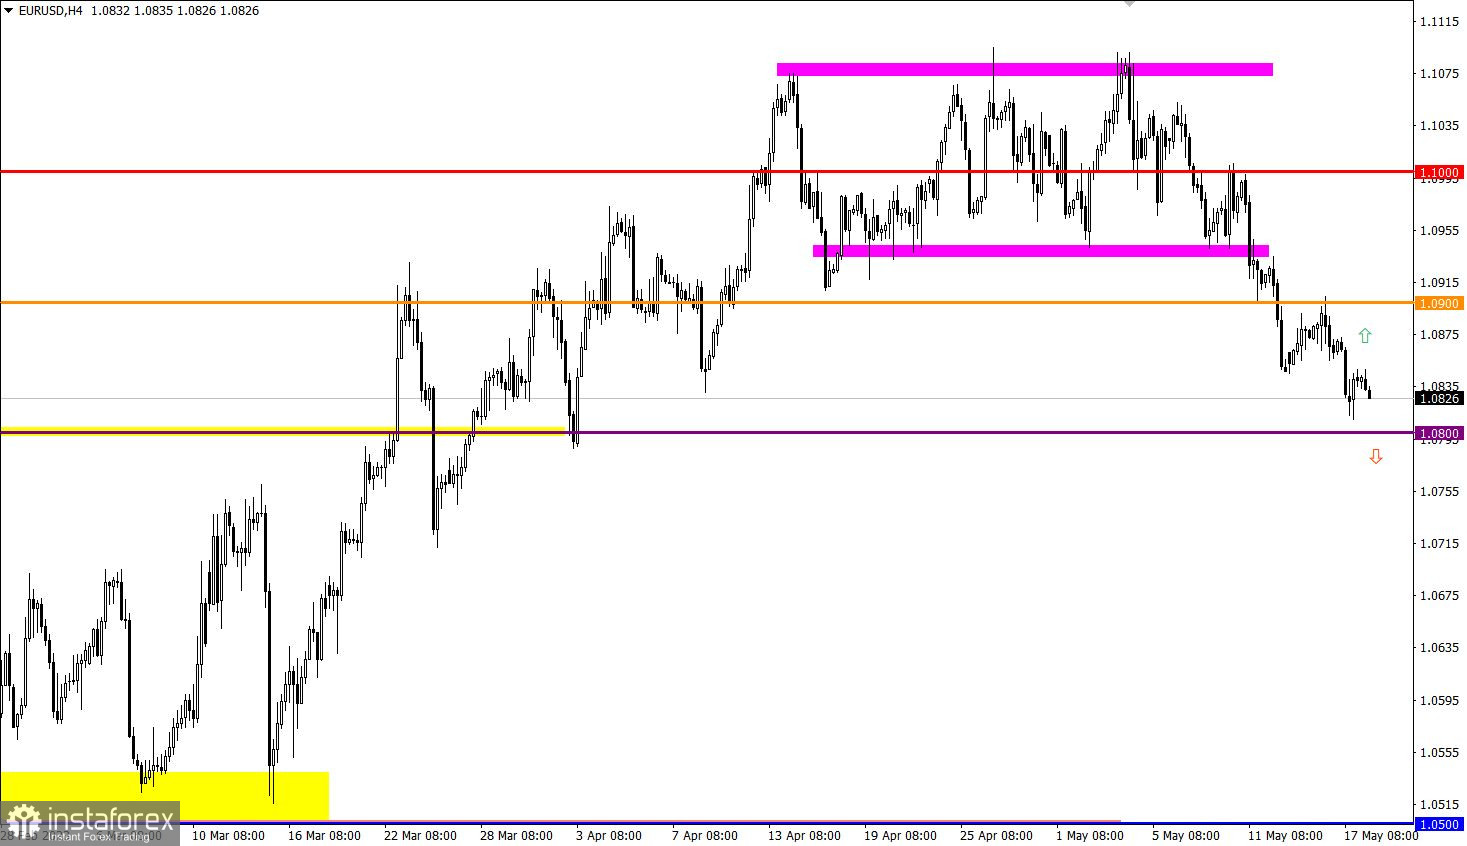
EUR/USD nearly reached the 1.0800 support level during the inertial movement. This triggered a technical signal of the euro being oversold and led to a reduction in short positions.
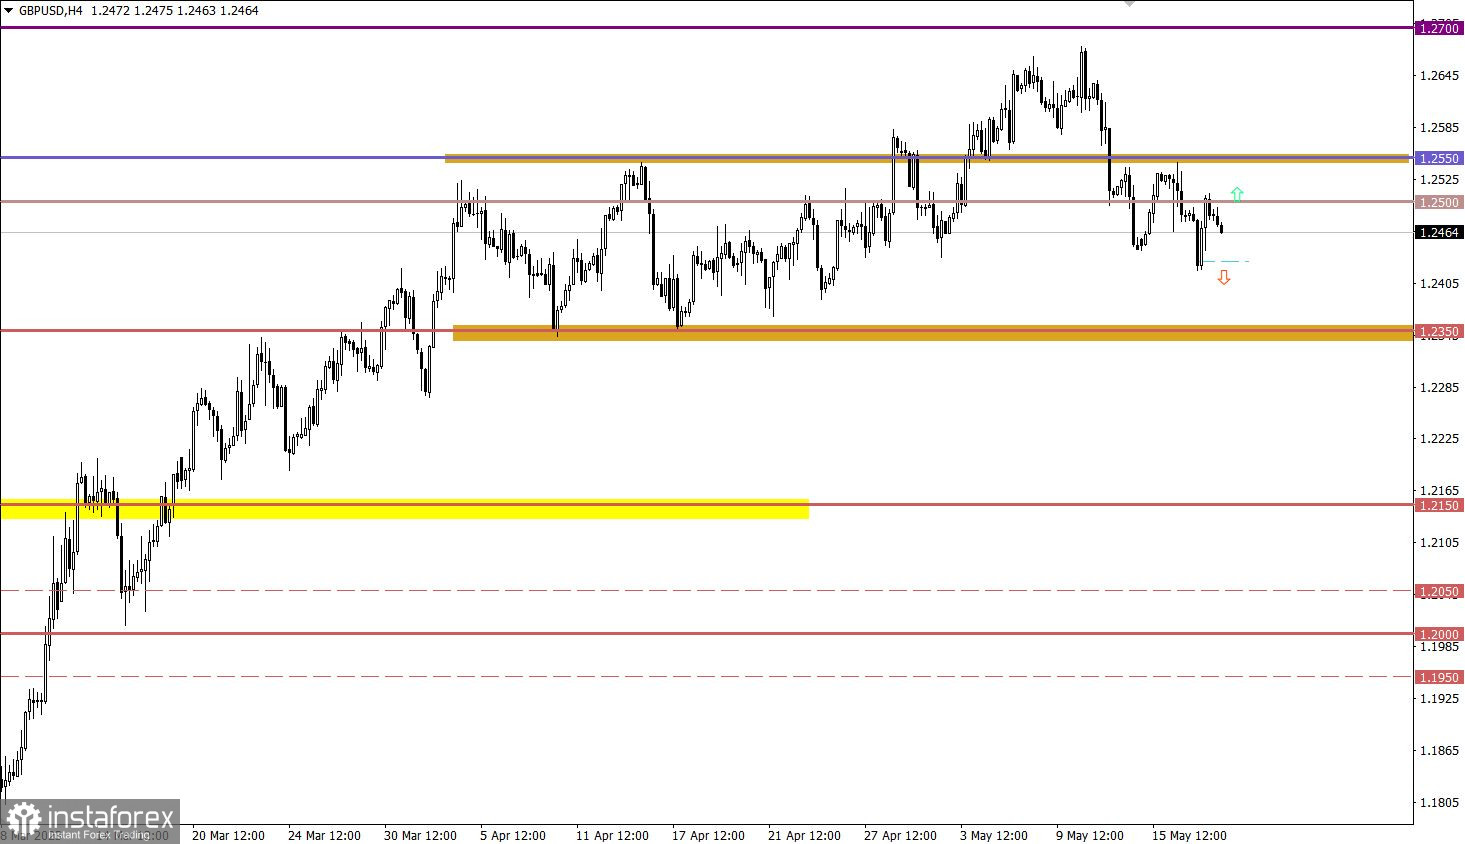
GBP/USD updated its local low during the correction, dropping the price below the 1.2430 mark. However, the sellers' joy was short-lived, as an immediate rebound occurred, and the quote returned to the level of the trading day's opening.
During the American trading session, U.S. unemployment claims will be published, where a slight decrease in the total figure is expected. The details of the statistical data suggest that the volume of continuing claims may increase from 1.813 million to 1.818 million, while the volume of initial claims may fell from 264,000 to 254,000.
Schedule:
U.S. unemployment claims – 12:30 UTC
In this situation, the 1.0800 level is a variable support from which a rebound occurred. For further depreciation, the quote needs to stay below this value, at least in the four-hour period. Otherwise, stagnation may occur.
Despite a slight rebound, the corrective movement in the market still continues. A return of the price below the level of 1.2440 may resume short positions and lead to a new local low in the correction cycle. As for the upward scenario, to get a full-fledged technical signal for the recovery of the pound rate relative to the correction, the price needs to stay above the level of 1.2550, at least in the four-hour period.
The candlestick chart type is white and black graphic rectangles with lines above and below. With a detailed analysis of each individual candle, you can see its characteristics relative to a particular time frame: opening price, closing price, intraday high and low.
Horizontal levels are price coordinates, relative to which a price may stop or reverse its trajectory. In the market, these levels are called support and resistance.
Circles and rectangles are highlighted examples where the price reversed in history. This color highlighting indicates horizontal lines that may put pressure on the asset's price in the future.
The up/down arrows are landmarks of the possible price direction in the future.
InstaForex analytical reviews will make you fully aware of market trends! Being an InstaForex client, you are provided with a large number of free services for efficient trading.


