 Zostať
Podmienky obchodovania
Nástroje


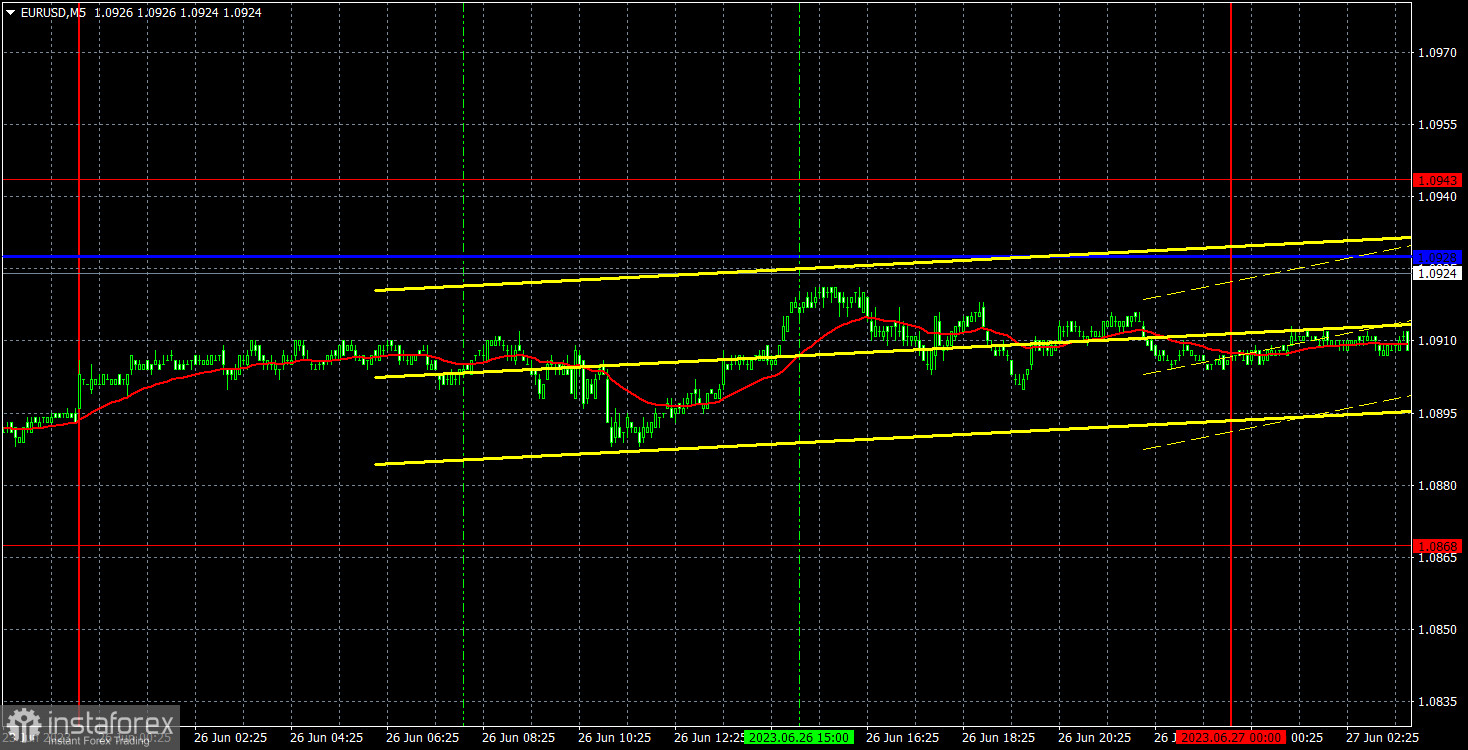
There was nothing interesting about the EUR/USD pair's movement on Monday. No significant macroeconomic reports either, but there was a speech by European Central Bank President Christine Lagarde. However, it took place in the evening, and over the past two weeks, we have witnessed a large number of speeches by ECB officials. Since there were no sharp movements, the conclusion is clear: Lagarde did not provide any important information to the market. And what could she say, apart from the usual statements of "the need to continue the fight against inflation" and "interest rates will continue to rise"? Volatility was 33 pips.
There is not much to say about trading signals either. With a volatility of around 30 pips, even if there were signals, it would not make sense to trade. And since we didn't have any signals, it was best not to enter the market. In recent months, the pair's volatility has significantly decreased, and the pair itself has been trading in the range of 1.05-1.11 for six months now.
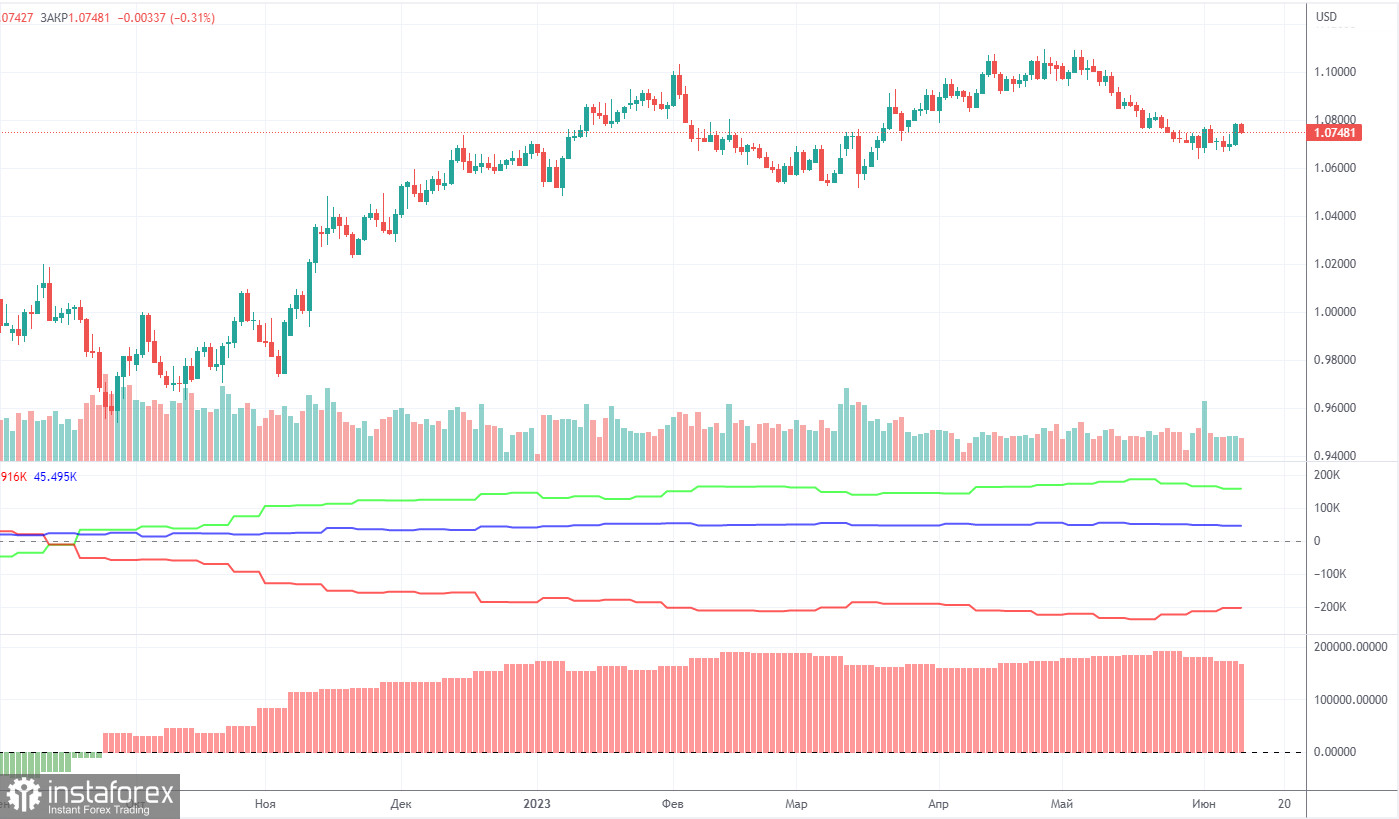
On Friday, a new COT report for June 20 was released. In the last 10 months, COT reports have fully corresponded to what is happening on the market. The chart above clearly shows that the net position of big traders (the second indicator) began to grow again in September 2022. At the same time, the euro resumed an upward movement. The net position of non-commercial traders is bullish. The euro is trading at its highs against the US dollar. I have already mentioned that a fairly high value of the "net position" indicates the end of the uptrend. The first indicator also signals such a possibility as the red and green lines are very far from each other. It often occurs before the end of the trend. The euro tried to start falling a few months ago but there was only a pullback.
During the last reporting week, the number of long positions of the "non-commercial" group of traders increased by 3,200 and the number of short positions rose by 10,400. Accordingly, the net position fell by 7,200 contracts. At the moment, even without the COT reports, it is clear that the pair should continue to decline.
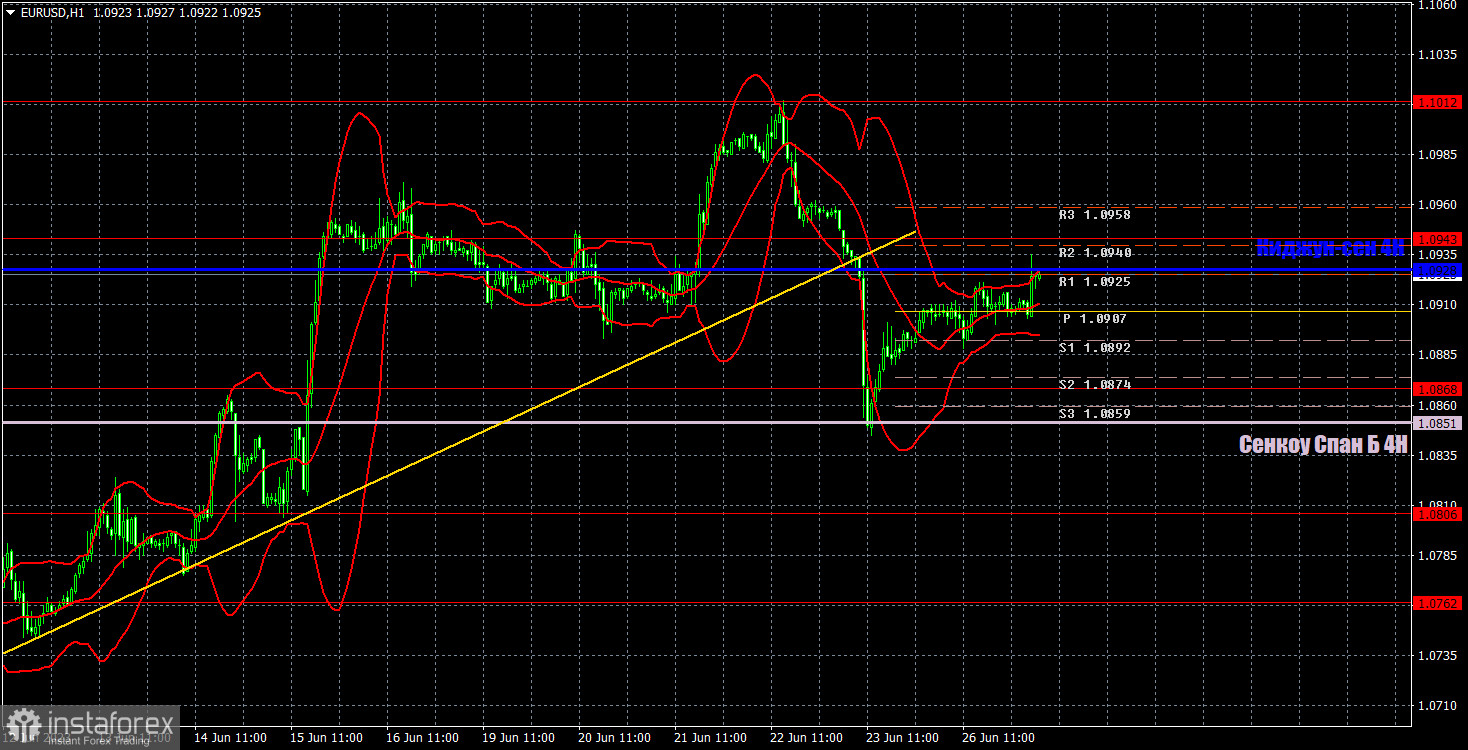
In the 1-hour chart, the pair consolidated below the ascending trendline but failed to overcome the important Senkou Span B line. Now it has returned to the critical line. A bounce from this line could trigger a move back towards the lower band of the Ichimoku cloud. Now is a good time for a new leg of a downtrend. However, breaking out of the 1.05-1.11 range will be quite challenging.
On June 27, trading levels are seen at 1.0658-1.0669, 1.0762, 1.0806, 1.0868, 1.0943, 1.1012, 1.1092, 1.1137, as well as the Senkou Span B line (1.0734) and the Kijun-sen (1.0928) lines. Ichimoku indicator lines can move intraday, which should be taken into account when determining trading signals. There are also support and resistance although no signals are made near these levels. Signals could be made when the price either breaks or bounces from these extreme levels. Do not forget to place Stop Loss at the breakeven point when the price goes by 15 pips in the right direction. In case of a false breakout, it could save you from possible losses.
This morning, Lagarde is due to give another speech at the ECB's economic forum in Sintra. In the US, reports on durable goods orders and new home sales will be published. These reports aren't that important, but they can stir some market reaction amid low volatility. It is unlikely that Lagarde will share any significant information with the market.
Resistance/support - thick red lines, near which the trend may stop. They do not make trading signals.
Kijun-sen and Senkou Span B are the Ichimoku indicator lines moved to the hourly timeframe from the 4-hour timeframe. They are also strong lines.
Extreme levels are thin red lines, from which the price used to bounce earlier. They can produce trading signals.
Yellow lines are trend lines, trend channels, and other technical patterns.
Indicator 1 on the COT chart is the size of the net position of each trader category.
Indicator 2 on the COT chart is the size of the net position for the Non-commercial group of traders.
InstaForex analytical reviews will make you fully aware of market trends! Being an InstaForex client, you are provided with a large number of free services for efficient trading.


