 Zostať
Podmienky obchodovania
Nástroje


On Wednesday, GBP/USD also tried to continue its downward movement but reversed and moved upward in the second half of the day. Volatility remained low, even though Federal Reserve Chair Jerome Powell just delivered a speech, with another one scheduled for Thursday. It's not clear if Powell's speech had a significant impact on the market; otherwise, the reaction would have been much stronger. The pair's upward movement was neither sharp nor strong.
There were no significant events in the UK, so there is nothing to analyze. The corrective phase remains intact, but at the same time, it's still a good time to resume the medium-term downtrend.
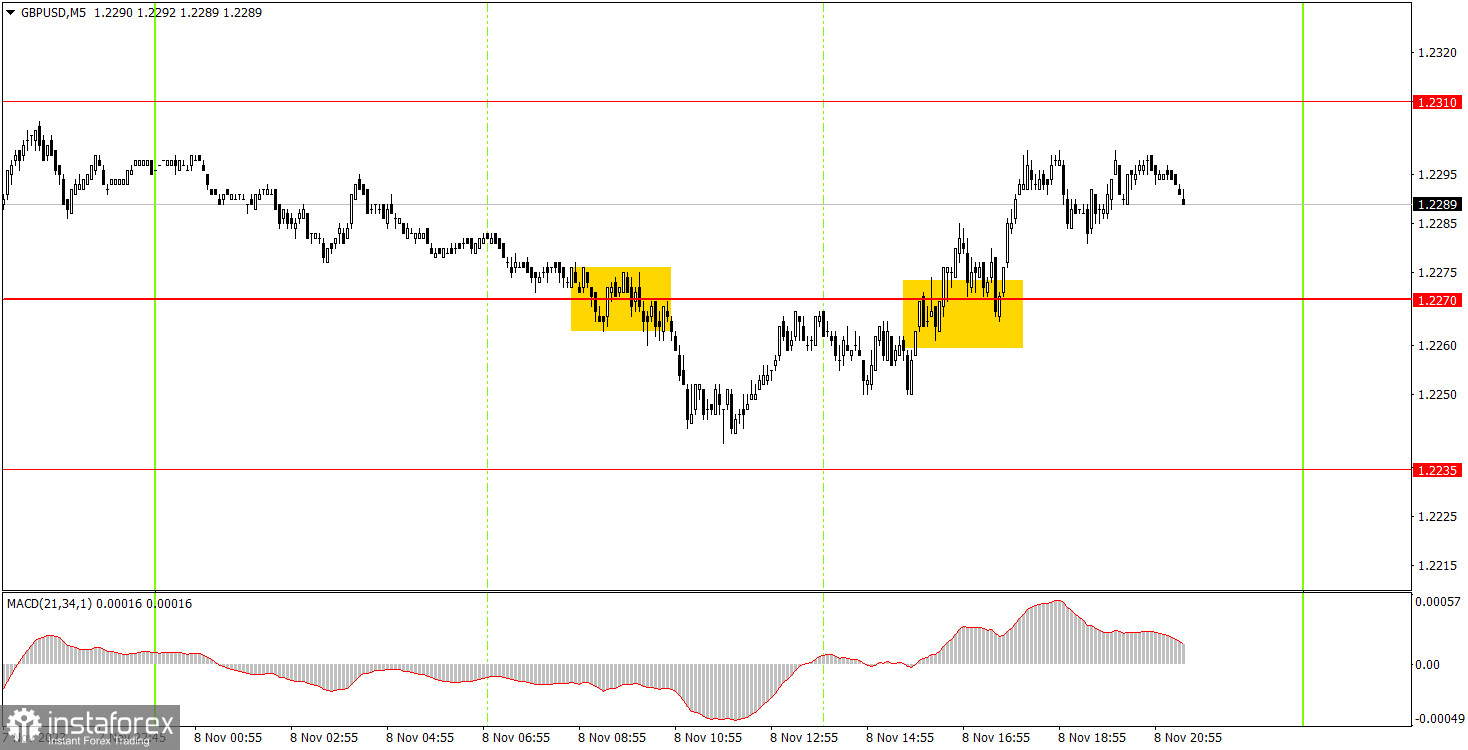
On the 5-minute chart, two trading signals were generated, both around the 1.2270 level. Initially, the pair moved below this mark and managed to drop 20 pips, and then it rose above this level and gained 20 pips as well. A breakeven stop loss should have been set in both cases, and neither of the trades had the opportunity to close at a loss. The second long position could even have been closed in profit, as it should have been closed manually closer to the evening. However, the potential profit wasn't high.
On the 30-minute chart, we had been anticipating a proper upward correction cycle for the GBP/USD pair for quite some time, and it has finally materialized. However, at this point, it seems that this correction is already coming to an end. If that's the case, we expect the downtrend to resume. Now everything depends on the level of 1.2270, which the pair has yet to breach, but it has been tested. The downward movement could start on Thursday. The key levels on the 5M chart are 1.1992-1.2010, 1.2052, 1.2089-1.2107, 1.2164-1.2179, 1.2235, 1.2270, 1.2310, 1.2372-1.2394, 1.2457-1.2488, 1.2544, 1.2605-1.2620, 1.2653, 1.2688. Once the price moves 20 pips in the right direction after opening a trade, you can set the stop-loss at breakeven. On Thursday, there are no significant events planned in the UK. From the US, the report on initial jobless claims is not exactly crucial, but there's also Powell's second speech for this week. If its content is similar to the speech he just concluded, there is no need to expect market reactions.
1) Signal strength is determined by the time taken for its formation (either a bounce or level breach). A shorter formation time indicates a stronger signal.
2) If two or more trades around a certain level are initiated based on false signals, subsequent signals from that level should be disregarded.
3) In a flat market, any currency pair can produce multiple false signals or none at all. In any case, the flat trend is not the best condition for trading.
4) Trading activities are confined between the onset of the European session and mid-way through the U.S. session, after which all open trades should be manually closed.
5) On the 30-minute timeframe, trades based on MACD signals are only advisable amidst substantial volatility and an established trend, confirmed either by a trendline or trend channel.
6) If two levels lie closely together (ranging from 5 to 15 pips apart), they should be considered as a support or resistance zone.
Support and Resistance price levels can serve as targets when buying or selling. You can place Take Profit levels near them.
Red lines represent channels or trend lines, depicting the current market trend and indicating the preferable trading direction.
The MACD(14,22,3) indicator, encompassing both the histogram and signal line, acts as an auxiliary tool and can also be used as a signal source.
Significant speeches and reports (always noted in the news calendar) can profoundly influence the price dynamics. Hence, trading during their release calls for heightened caution. It may be reasonable to exit the market to prevent abrupt price reversals against the prevailing trend.
Beginners should always remember that not every trade will yield profit. Establishing a clear strategy coupled with sound money management is the cornerstone of sustained trading success.
InstaForex analytical reviews will make you fully aware of market trends! Being an InstaForex client, you are provided with a large number of free services for efficient trading.


