 Zostať
Podmienky obchodovania
Nástroje


GBP/USD started a logical and consistent decline on Wednesday. It started in the absence of a fundamental and macroeconomic background, overnight. However, it did not last very long. The price quickly encountered the level of 1.2620, near which the Senkou Span B line was located. At the same time, the US GDP report came in slightly weaker, nullifying all of the bears' efforts. Thus, the pair bounced back up and in the near future, it may test the level of 1.2691 for the fifth or sixth time.
Yesterday, we talked about a flat within a flat. If we switch to the daily timeframe, the flat is clearly visible, which has been ongoing for several months. And on the hourly chart, we have a sideways channel of 1.2620-1.2691. The pair spent the last week in it. Therefore, we only have a sideways movement on almost all the charts. Do I still have to say that it is difficult to trade in a flat? And it's even more challenging in a low-volatility flat. Today, the price breached the ascending trendline, so the pound may fall. But first, the price needs to break out of another sideways channel...
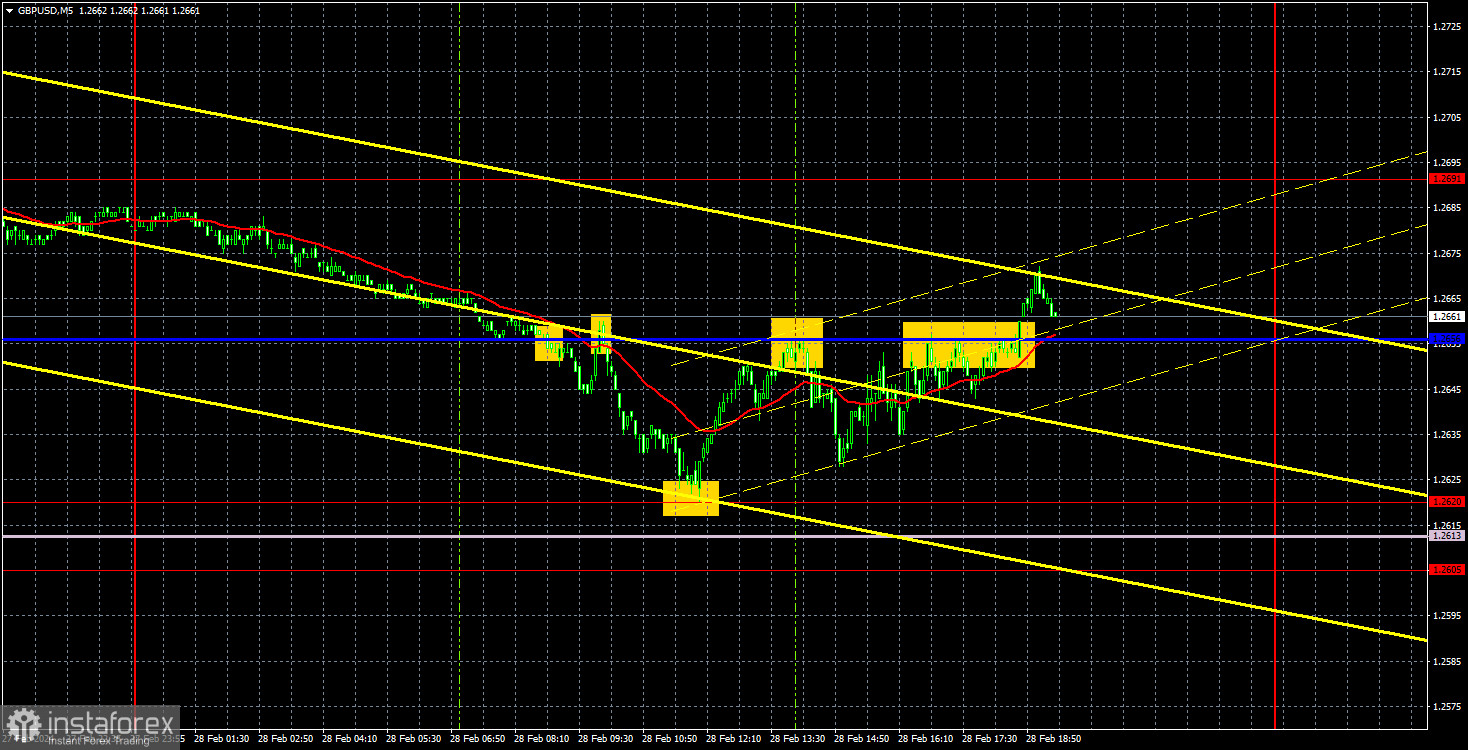
There were plenty of trading signals on Wednesday, and almost all of them were accurate. First, the pair broke through the critical line, so traders could open short positions while aiming for 1.2620. The quote rebounded from the level of 1.2620, so traders could open long positions. Then there was a new rebound from the critical line. The last buy signal formed near the same Kijun-sen line. Traders could open a total of four trades. The first two brought profits of about 30 pips each, the third closed with a Stop Loss to breakeven, and the fourth closed manually with no profit or loss.
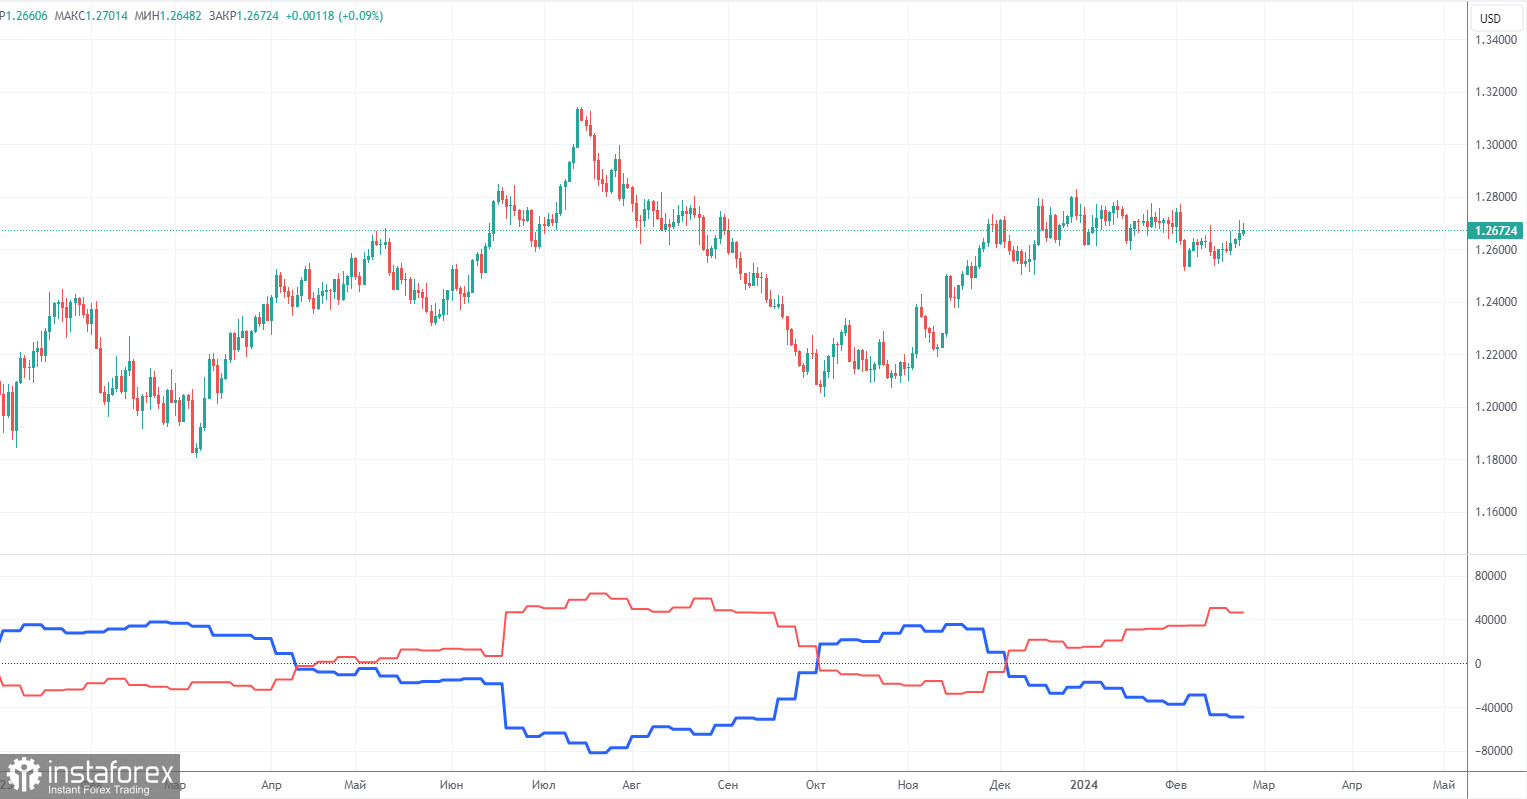
COT reports on the British pound show that the sentiment of commercial traders has frequently changed in recent months. The red and blue lines, which represent the net positions of commercial and non-commercial traders, constantly intersect and, in most cases, remain close to the zero mark. According to the latest report on the British pound, the non-commercial group closed 2,900 buy contracts and opened 1,200 short ones. As a result, the net position of non-commercial traders decreased by 4,100 contracts in a week. Despite the fact that the net position of speculators is growing, the fundamental background still does not provide a basis for long-term purchases of the pound sterling.
The non-commercial group currently has a total of 87,600 buy contracts and 42,300 sell contracts. The advantage of the bulls is almost twofold. However, in recent months, we have repeatedly encountered similar situations: the net position either increases or decreases, the advantage passes from bulls to bears and vice versa. Since the COT reports do not provide an accurate forecast of the market's behavior at the moment, we have to scrutinize the technical picture and economic reports. The technical analysis suggests that there's a possibility that the pound could show a pronounced downward movement, and the economic reports have also been significantly stronger in the United States than in the United Kingdom, but this has not benefited the dollar.
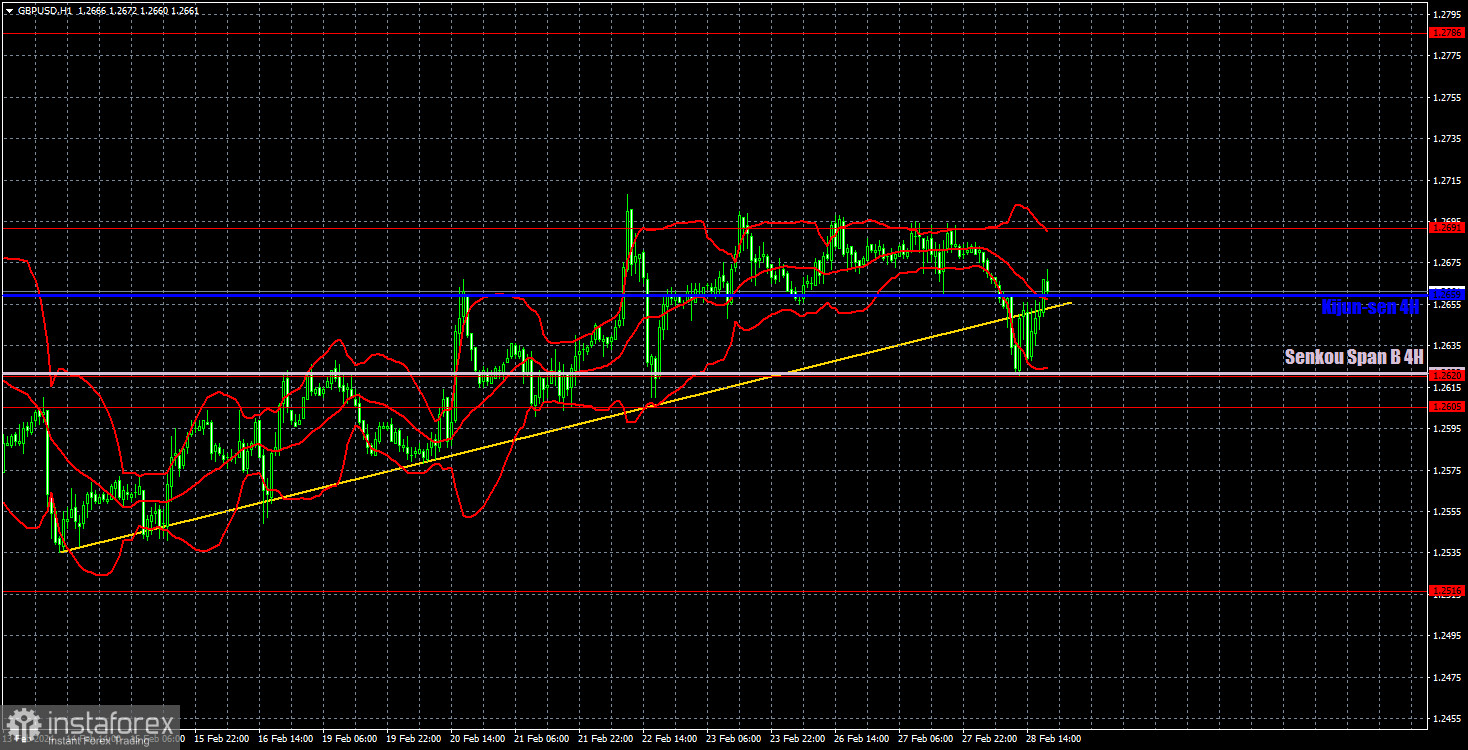
On the 1H chart, GBP/USD left the sideways channel of 1.2611-1.2787 and it still has the potential to form a downtrend. However, recently, we've noticed that the market is not in a rush to sell the pound. The price has been moving sideways (which is clear on the higher timeframes), market participants feel comfortable in the range. The British pound is still a currency that tends to move sideways, trading in a somewhat illogical and confusing manner. On lower timeframes, we regularly observe short-term trends, but it has been quite difficult to make profit from them, as the price constantly changes its direction, and volatility is low.
As of February 29, we highlight the following important levels: 1.2215, 1.2269, 1.2349, 1.2429-1.2445, 1.2516, 1.2605-1.2620, 1.2691, 1.2786, 1.2863, 1.2981-1.2987. The Senkou Span B line (1.2622) and the Kijun-sen line (1.2659) lines can also serve as sources of signals. Don't forget to set a Stop Loss to breakeven if the price has moved in the intended direction by 20 pips. The Ichimoku indicator lines may move during the day, so this should be taken into account when determining trading signals.
On Thursday, there are no important events lined up in the UK. The US will release reports on personal income/expenditure of the American population, jobless claims, and the Personal Consumption Expenditures (PCE) Price Index. These are relatively minor reports, but in conditions of low volatility and an empty economic calendar, even these reports can provoke a visible market reaction.
Support and resistance levels are thick red lines near which the trend may end. They do not provide trading signals;
The Kijun-sen and Senkou Span B lines are the lines of the Ichimoku indicator, plotted to the 1H timeframe from the 4H one. They provide trading signals;
Extreme levels are thin red lines from which the price bounced earlier. They provide trading signals;
Yellow lines are trend lines, trend channels, and any other technical patterns;
Indicator 1 on the COT charts is the net position size for each category of traders;
Indicator 2 on the COT charts is the net position size for the Non-commercial group.
InstaForex analytical reviews will make you fully aware of market trends! Being an InstaForex client, you are provided with a large number of free services for efficient trading.

