 Zostať
Podmienky obchodovania
Nástroje


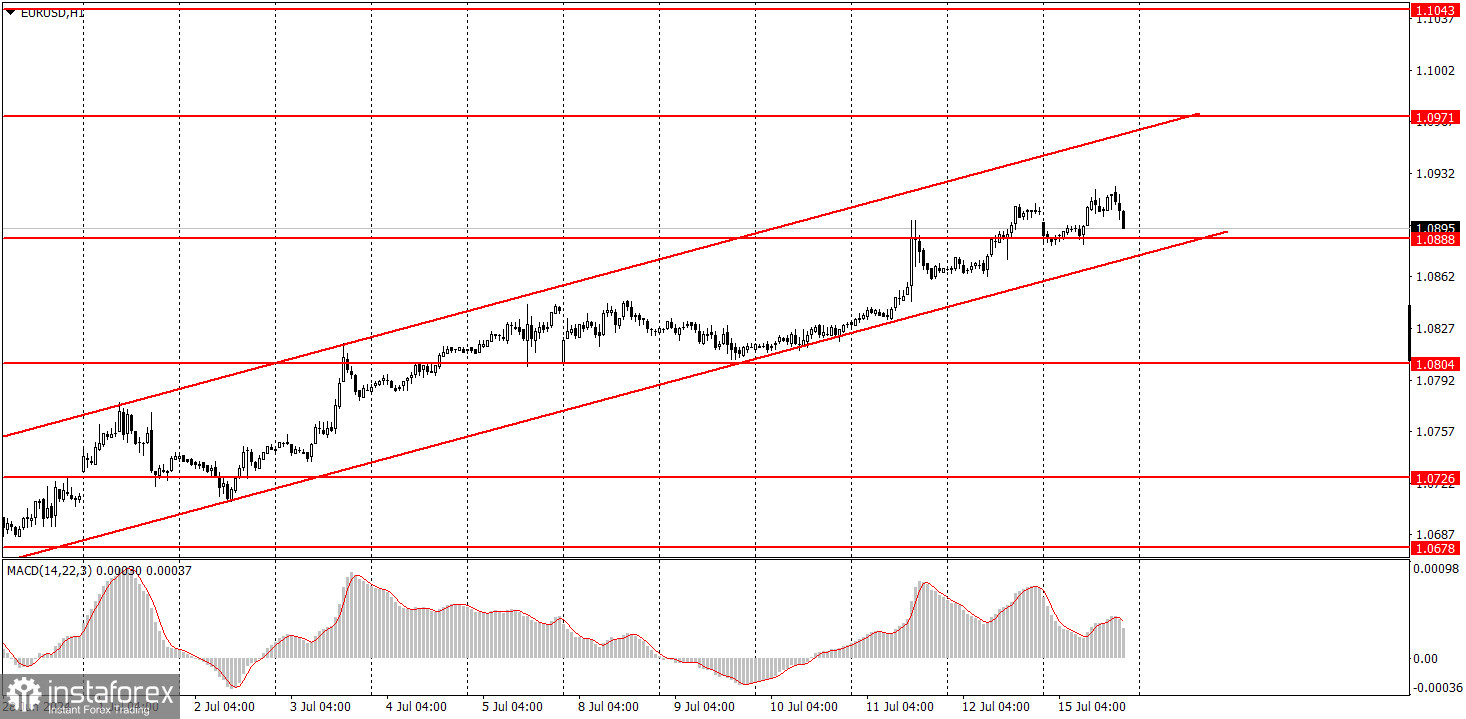
EUR/USD trading was so boring that I don't even want to talk about it. Moreover, this time "boring" does not mean weak volatility (which is understandable) or movements, but because the euro was rising again. As we have repeatedly mentioned, the market constantly finds more and more reasons to buy the euro and even refuses to take a break from it. On Monday, the market could have bought the euro based on the industrial production report, which showed that output was down by 0.6% in the euro area, but the forecasts were even worse. Surprisingly, a drop of 0.6% is a positive result for the single currency. This is how the euro and pound are rising against the dollar. The forecasts for the U.S. data are overestimated, while those for the European and UK data are underestimated. The ascending channel remains intact, so there is no technical reason to sell the pair at this time.
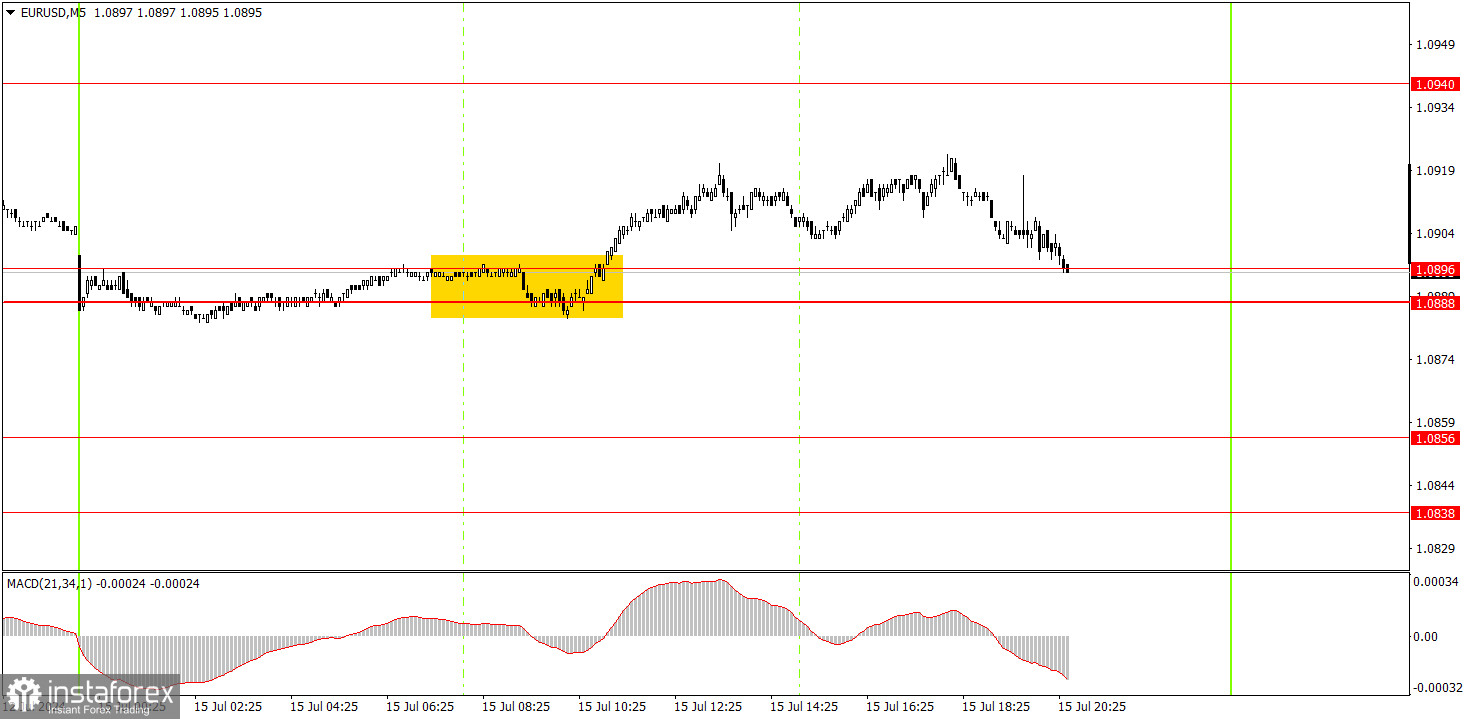
Only one trading signal was generated on the 5-minute timeframe. During the European trading session, the price rebounded from the 1.0888-1.0896 area, after which it managed to climb about 20 pips by the end of the day, and novice traders could earn this amount of profit. You can also leave long positions for Tuesday, since volatility remains quite low and in order to make a good profit, you should spend several days in the market on one transaction.
On the hourly chart, EUR/USD continues its local upward trend. Sometimes the market has a good reason to buy the pair, and when it doesn't, it just comes up with a reason. The single currency is firmly rising almost every day. The current movement seems illogical, but from a technical perspective, everything appears natural.
On Tuesday, novice traders can stay in long positions based on the signal of overcoming the 1.0888-1.0896 area. In general, you may consider long positions before the price consolidates below the channel.
The key levels on the 5M chart are 1.0483, 1.0526, 1.0568, 1.0611, 1.0678, 1.0726-1.0733, 1.0797-1.0804, 1.0838-1 should be considered. 0856, 1.0888-1.0896, 1.0940, 1.0971-1.0981. The European Union is set to publish the ZEW economic expectations index for Germany and the EU. The U.S. docket features a retail sales report. These are not crucial reports, so we don't expect a strong market reaction to it. Market participants may continue to buy the euro.
1) Signal strength is determined by the time taken for its formation (either a bounce or level breach). A shorter formation time indicates a stronger signal.
2) If two or more trades around a certain level are initiated based on false signals, subsequent signals from that level should be disregarded.
3) In a flat market, any currency pair can produce multiple false signals or none at all. In any case, the flat trend is not the best condition for trading.
4) Trading activities are confined between the onset of the European session and mid-way through the U.S. session, after which all open trades should be manually closed.
5) On the 30-minute timeframe, trades based on MACD signals are only advisable amidst substantial volatility and an established trend, confirmed either by a trendline or trend channel.
6) If two levels lie closely together (ranging from 5 to 15 pips apart), they should be considered as a support or resistance zone.
Support and Resistance price levels can serve as targets when buying or selling. You can place Take Profit levels near them.
Red lines represent channels or trend lines, depicting the current market trend and indicating the preferable trading direction.
The MACD(14,22,3) indicator, encompassing both the histogram and signal line, acts as an auxiliary tool and can also be used as a signal source.
Significant speeches and reports (always noted in the news calendar) can profoundly influence the price dynamics. Hence, trading during their release calls for heightened caution. It may be reasonable to exit the market to prevent abrupt price reversals against the prevailing trend.
Beginners should always remember that not every trade will yield profit. Establishing a clear strategy coupled with sound money management is the cornerstone of sustained trading success.
InstaForex analytical reviews will make you fully aware of market trends! Being an InstaForex client, you are provided with a large number of free services for efficient trading.

