 Zostať
Podmienky obchodovania
Nástroje


Pár EUR/USD v stredu pokračoval v pomalých pohyboch. Nový klesajúci trend sa začal po tom, ako cena vyšla z rastúceho kanála. Pozor však na tempo, akým sa cena pohybuje smerom nadol. Za tri dni klesla o 60 pipov, čo predstavuje približne 20 pipov denne. Takto sa pár obchoduje už 3 až 4 mesiace. Včera boli v eurozóne a v USA konečne zverejnené prvé správy tohto týždňa, ktoré však obchodníkov len zmiatli. Bez týchto správ by pár možno pokračoval v pomalom pohybe nadol alebo by postupne začal býčiu korekciu. Namiesto toho sme v dôsledku vplyvu hospodárskych správ zaznamenali dva intradenné obraty, ktoré pohyb páru ešte viac skomplikovali. Údaje o PMI v eurozóne boli horšie, ako sa očakávalo, čo viedlo k rannému poklesu eura. Neskôr index výrobnej aktivity v USA klesol pod úroveň 50,0, čo vyvolalo tlak na dolár. Celkovo sa očakáva, že pár bude pokračovať v klesajúcom trende, ale ako sme často hovorili, môže byť pomalý a nepravidelný.
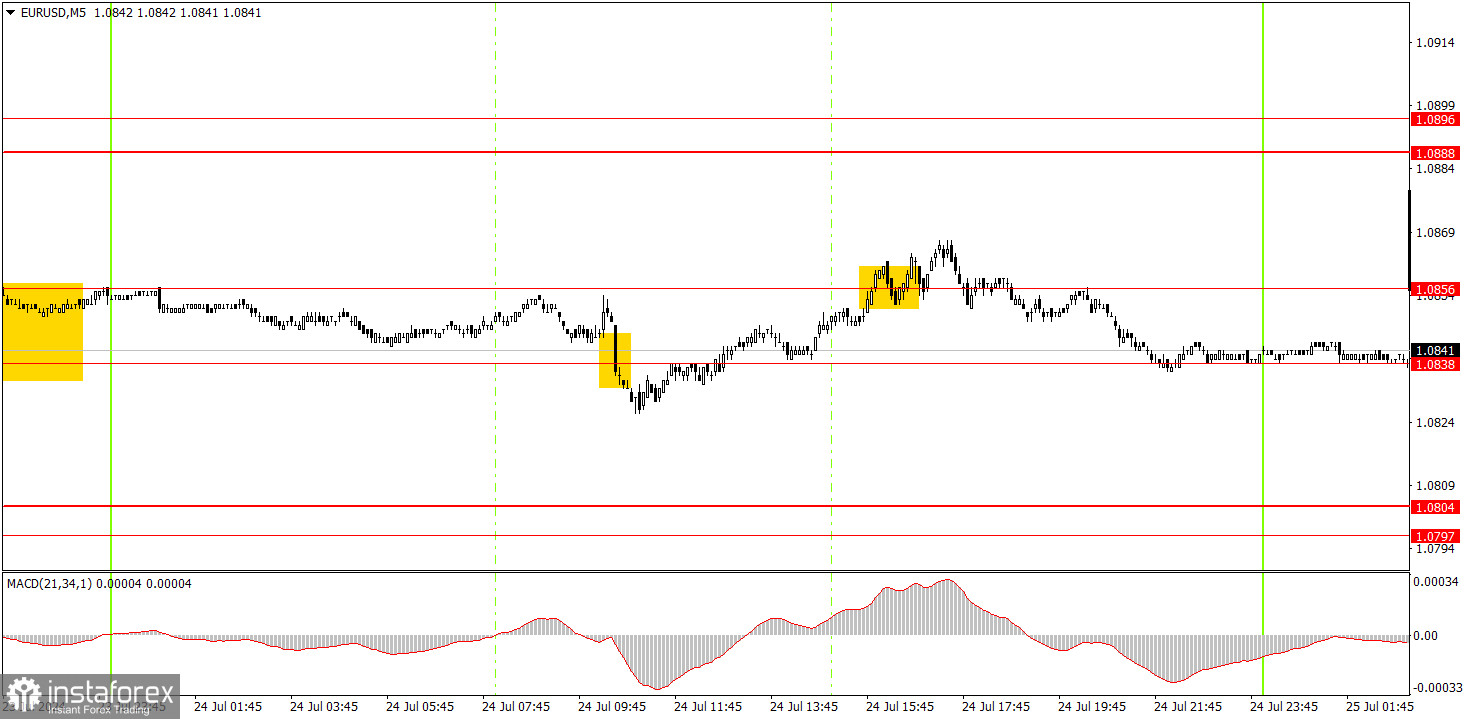
V 5-minútovom grafe sú viditeľné vyššie uvedené obraty, ktoré negatívne ovplyvnili intradenné obchodovanie. Cena sa najprv usadila pod pásmom 1,0838 - 1,0856 a následne nad ním. Cena sa v zamýšľanom smere nepohla ani o desať pipov. Ak teda začínajúci obchodníci konali na základe týchto signálov, pravdepodobne utrpeli len straty. Ekonomické správy boli v stredu bohužiaľ skôr prekážkou ako pomocou.
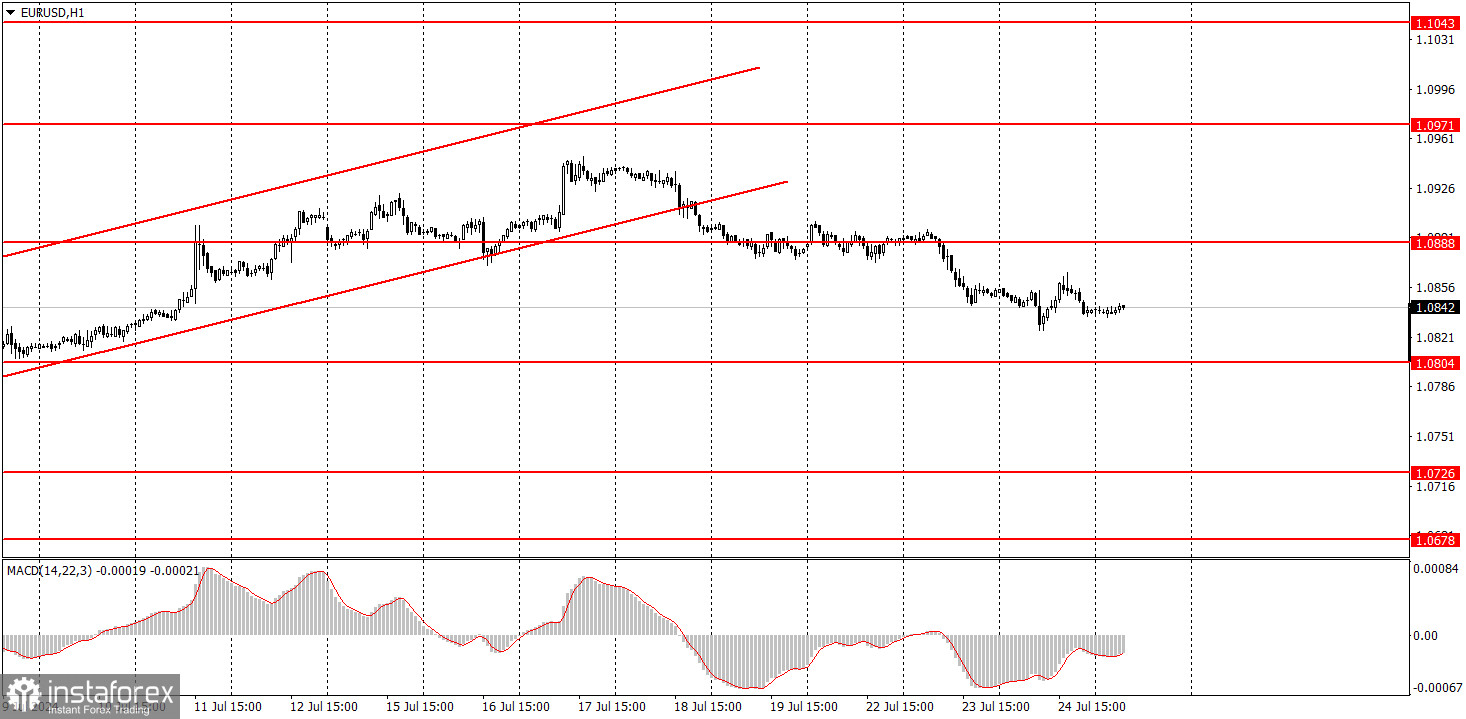
Pár EUR/USD sa na hodinovom grafe usadil pod stúpajúcim kanálom, čo mu umožnilo začať nový lokálny klesajúci trend. Euro opäť plne zohľadnilo všetky býčie faktory, takže je potrebná výrazná korekcia. Charakter pohybov je však najlepšie vidieť na 24-hodinovom grafe. Ide o rovnaké bočné pásmo medzi úrovňou 1,0650 a 1,1000.
Vo štvrtok môžu začínajúci obchodníci skúsiť obchodovať z oblasti 1,0838 - 1,0856. Dnes sa uskutoční niekoľko dôležitých udalostí, ale už včera sme videli, ako môžu ekonomické správy narušiť technický obraz. Očakávame, že ceny budú rásť a následne môže dôjsť k poklesu.
Kľúčové úrovne na 5-minútovom grafe sú 1,0526, 1,0568, 1,0611, 1,0678, 1,0726 ‒ 1,0733, 1,0797 ‒ 1,0804, 1,0838 ‒ 1,0856, 1,0888 ‒ 1,0896, 1,0940, 1,0971 ‒ 1,0981. Dnes vystúpi prezidentka Európskej centrálnej banky Christine Lagardeová a v USA budú zverejnené dôležité správy o objednávkach tovarov dlhodobej spotreby a HDP za 2. štvrťrok. Neboli by sme prekvapení, keby na tieto udalosti nebola žiadna reakcia, keďže údaje môžu byť úplne neutrálne.
1) Sila signálu sa určuje podľa času, ktorý je potrebný na jeho vytvorenie (buď odrazom alebo prelomením úrovne). Ak signál vznikne za kratší čas, znamená to, že je silnejší.
2) Ak sa na základe falošných signálov otvoria na určitej úrovni dva alebo viac obchodov, následné signály z tejto úrovne by sa nemali brať do úvahy.
3) Na trhu bez jednoznačného trendu môže akýkoľvek menový pár vytvoriť viacero falošných signálov alebo žiadny signál. V každom prípade trh bez trendu nepatrí medzi vhodné podmienky na obchodovanie.
4) Obchodné aktivity sa vykonávajú od začiatku európskej seansy do polovice americkej seansy, po ktorej by sa mali všetky otvorené obchody ručne zavrieť.
5) Otvoriť obchody na základe signálov MACD na 30-minútovom grafe sa odporúča, len ak je na trhu značná volatilita a ustálený trend, ktorý je potvrdený buď trendovou čiarou, alebo trendovým kanálom.
6) Ak dve úrovne ležia tesne vedľa seba (v rozmedzí 5 až 15 pipov), mali by sa považovať za zónu podpory alebo rezistencie.
7) Po pohybe 15 pipov v predpokladanom smere by mal byť stop loss nastavený na hranicu rentability.
Cenové úrovne podpory a rezistencie môžu slúžiť ako ciele pri nákupe alebo predaji. Do ich blízkosti môžete umiestniť úrovne take profit.
Červené čiary predstavujú kanály alebo trendové čiary, ktoré znázorňujú aktuálny trend na trhu a naznačujú očakávaný smer obchodovania.
Indikátor MACD (14,22,3), ktorý zahŕňa histogram aj signálnu čiaru, slúži ako pomocný nástroj a možno ho použiť aj ako zdroj signálov.
Významné prejavy a správy (vždy zaznamenané v kalendári správ) môžu zásadne ovplyvniť dynamiku cien. Preto si obchodovanie počas ich zverejnenia vyžaduje zvýšenú opatrnosť. Môže byť rozumné opustiť trh, aby sa zabránilo náhlym cenovým obratom proti prevládajúcemu trendu.
Začiatočníci by mali mať vždy na pamäti, že nie každý obchod prinesie zisk. Základom trvalého obchodného úspechu je stanovenie jasnej stratégie spolu s rozumným riadením peňazí.
InstaForex analytical reviews will make you fully aware of market trends! Being an InstaForex client, you are provided with a large number of free services for efficient trading.

