 Zostať
Podmienky obchodovania
Nástroje


Pár GBP/USD si v stredu nedokázal udržať svoj rast, čo je trochu prekvapujúce. Britská libra zvyčajne využíva každú príležitosť na rast. Včerajšia správa o inflácii v Spojenom kráľovstve však nedosiahla očakávané výsledky. Inými slovami, index spotrebiteľských cien síce vzrástol, ale menej, ako trh očakával. V dôsledku toho sa mierne zvýšila pravdepodobnosť, že britská centrálna banka na svojom najbližšom zasadnutí zníži sadzby, čo je pre britskú menu nepriaznivé. V popoludňajších hodinách bola zverejnená správa o inflácii v Spojených štátoch, ktorá ukázala spomalenie rastu z 3 % na 2,9 %. Z nášho pohľadu sa miera 2,9 % výrazne nelíši od 3 %. Ani jeden z týchto dvoch údajov neposkytuje Federálnemu rezervnému systému dôvod na začatie uvoľňovania menovej politiky. Napriek tomu sa trh opäť vrhol na predaj amerického dolára a len tesne sa vyhol zavretiu nad úrovňou 1,2860.
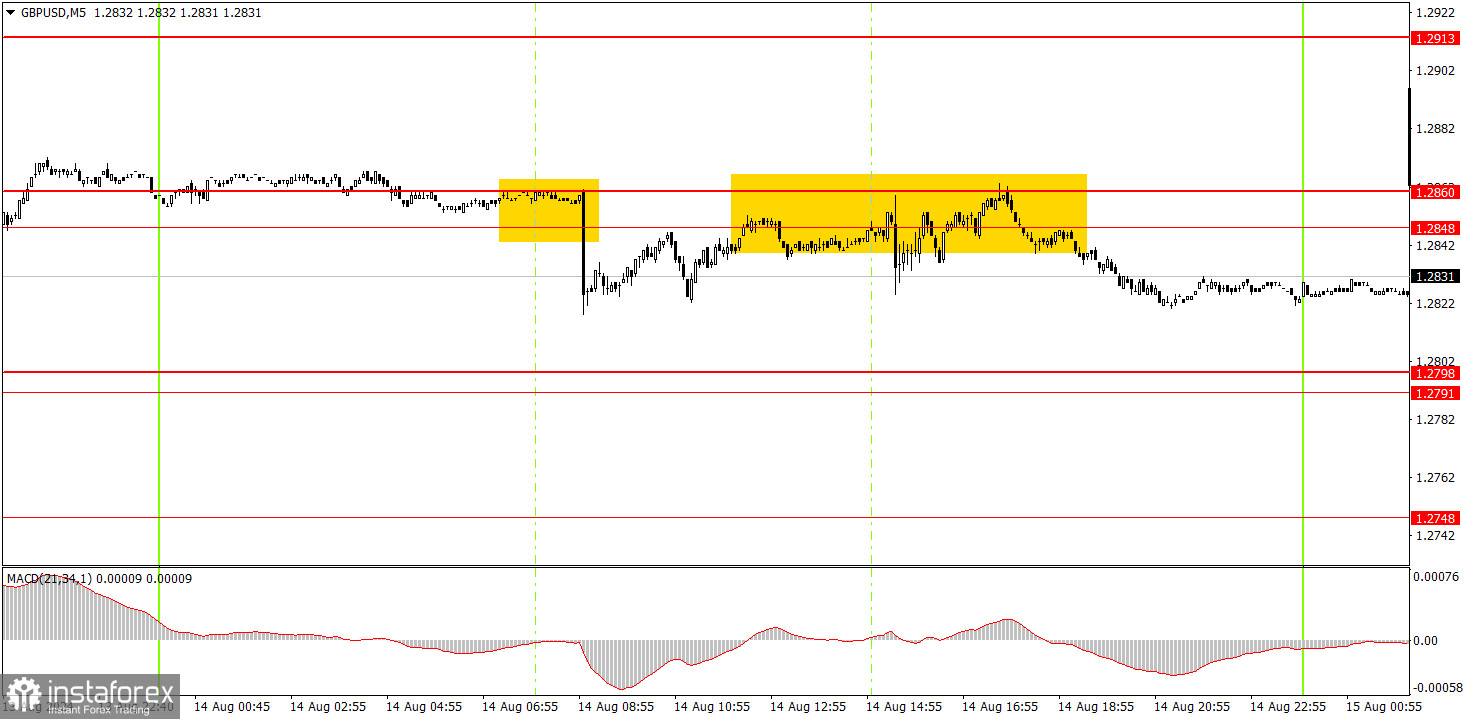
Na 5-minútovom grafe sa v stredu vytvorili dva predajné signály, ale oba boli pomerne nejasné. Volatilita dosahovala len 49 pipov a pri takejto nízkej volatilite je očakávanie dobrých signálov a zisku nereálne. Cena sa dvakrát odrazila od oblasti úrovní 1,2848 ‒ 1,2860. Prvý odraz viedol k päťminútovému poklesu páru, takže na základe tohto signálu nebola príležitosť vstúpiť na trh. Druhý signál sa vytvoril vo večerných hodinách, keď bol čas trh skôr opustiť ako naň vstúpiť.
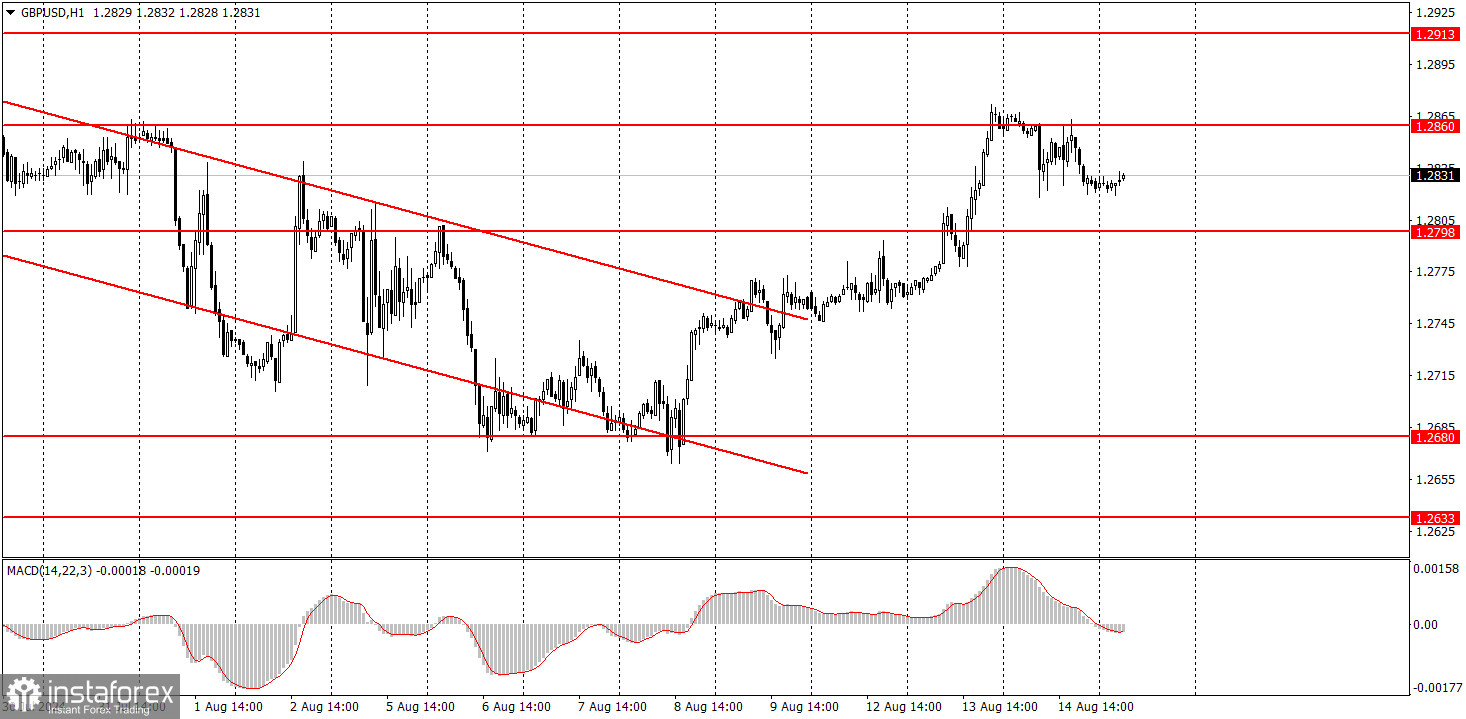
Pár GBP/USD má na hodinovom grafe dobrú šancu udržať si svoj klesajúci trend, avšak teraz prechádza korekciou smerom nahor. Britská libra je ešte stále prekúpená, zatiaľ čo dolár je podhodnotený a trh aj naďalej využíva každú príležitosť na nákup libry. Trh jednoducho ignoruje všetky nepriaznivé správy. Včera sa očakával nový pokles dolára, avšak nedošlo k nemu.
Vo štvrtok môžu začiatočníci znova obchodovať od oblasti úrovní 1,2748 – 1,2860 alebo 1,2791 – 1,2798. V Spojenom kráľovstve a USA budú zverejnené makroekonomické údaje, preto sa im oplatí venovať pozornosť.
Kľúčové úrovne na 5-minútovom grafe sú 1,2547, 1,2605 ‒ 1,2633, 1,2684 ‒1,2693, 1,2748, 1,2791 ‒ 1,2798, 1,2848 ‒ 1,2860, 1,2913, 1,2980 ‒ 1,2993, 1,3043, 1,3102 ‒ 1,3107, 1,3145. Vo štvrtok bude v Spojenom kráľovstve zverejnená správa o HDP a priemyselnej výrobe, zatiaľ čo v USA budú zverejnené maloobchodné tržby, priemyselná výroba a žiadosti o podporu v nezamestnanosti. Hoci tieto správy nie sú najzásadnejšie, je ich päť, takže by mohli ovplyvniť pohyb páru GBP/USD počas dňa.
1) Sila signálu sa určuje podľa času, ktorý je potrebný na jeho vytvorenie (buď odrazom alebo prelomením úrovne). Ak signál vznikne za kratší čas, znamená to, že je silnejší.
2) Ak sa na základe falošných signálov otvoria na určitej úrovni dva alebo viac obchodov, následné signály z tejto úrovne by sa nemali brať do úvahy.
3) Na trhu bez jednoznačného trendu môže akýkoľvek menový pár vytvoriť viacero falošných signálov alebo žiadny signál. V každom prípade trh bez trendu nepatrí medzi vhodné podmienky na obchodovanie.
4) Obchodné aktivity sa vykonávajú od začiatku európskej seansy do polovice americkej seansy, po ktorej by sa mali všetky otvorené obchody ručne zavrieť.
5) Otvoriť obchody na základe signálov MACD na 30-minútovom grafe sa odporúča, len ak je na trhu značná volatilita a ustálený trend, ktorý je potvrdený buď trendovou čiarou, alebo trendovým kanálom.
6) Ak dve úrovne ležia tesne vedľa seba (v rozmedzí 5 až 15 pipov), mali by sa považovať za zónu podpory alebo rezistencie.
7) Po pohybe 15 pipov v predpokladanom smere by mal byť stop loss nastavený na hranicu rentability.
Cenové úrovne podpory a rezistencie môžu slúžiť ako ciele pri nákupe alebo predaji. Do ich blízkosti môžete umiestniť úrovne take profit.
Červené čiary predstavujú kanály alebo trendové čiary, ktoré znázorňujú aktuálny trend na trhu a naznačujú očakávaný smer obchodovania.
Indikátor MACD (14,22,3), ktorý zahŕňa histogram aj signálnu čiaru, slúži ako pomocný nástroj a možno ho použiť aj ako zdroj signálov.
Významné prejavy a správy (vždy zaznamenané v kalendári správ) môžu zásadne ovplyvniť dynamiku cien. Preto si obchodovanie počas ich zverejnenia vyžaduje zvýšenú opatrnosť. Môže byť rozumné opustiť trh, aby sa zabránilo náhlym cenovým obratom proti prevládajúcemu trendu.
Začiatočníci by mali mať vždy na pamäti, že nie každý obchod prinesie zisk. Základom trvalého obchodného úspechu je stanovenie jasnej stratégie spolu s rozumným riadením peňazí.
InstaForex analytical reviews will make you fully aware of market trends! Being an InstaForex client, you are provided with a large number of free services for efficient trading.


