 Zostať
Podmienky obchodovania
Nástroje


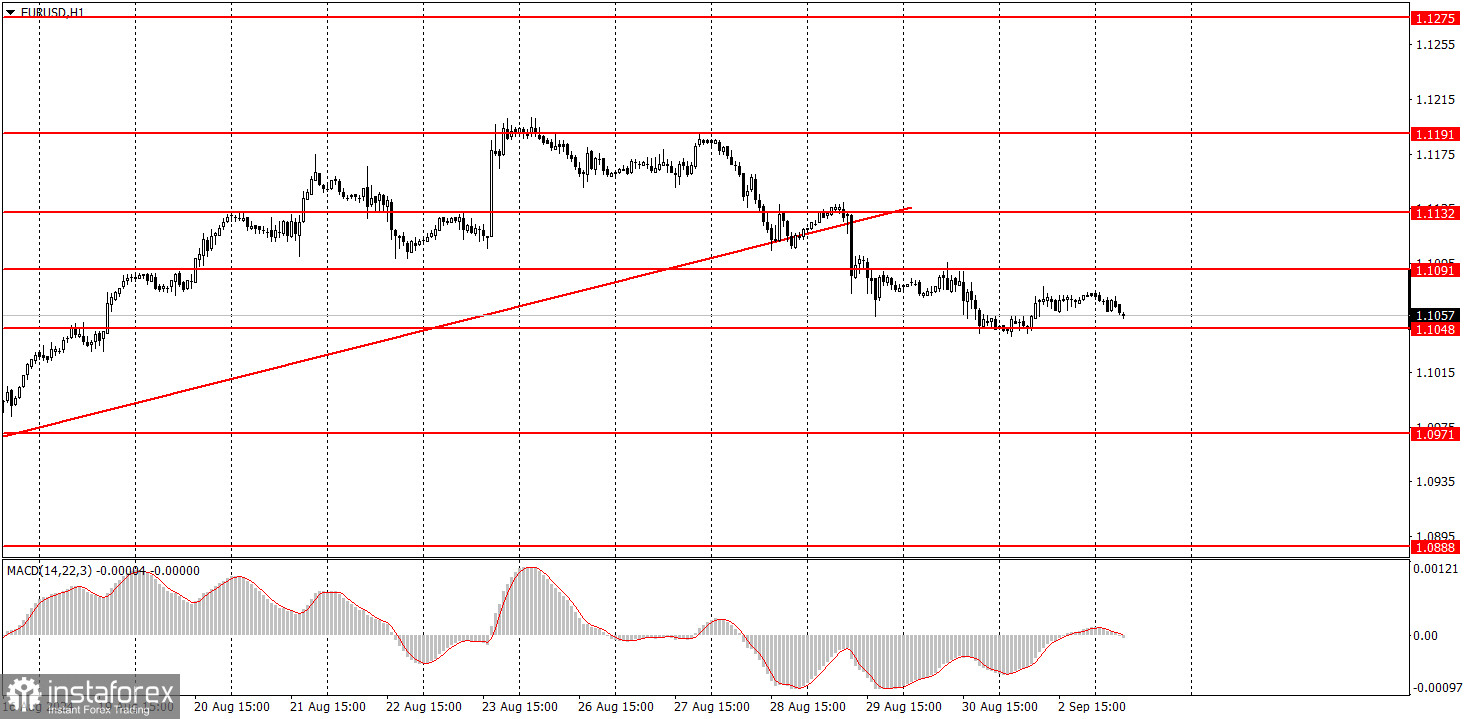
The EUR/USD pair did not exhibit any significant movements on Monday. The price failed to break through the 1.1048 level and then slightly corrected upwards. However, the pair is currently showing a downtrend, so we can expect the downward movement to continue.
As mentioned earlier, this week will largely depend on U.S. macroeconomic data. Of course, Friday's most important reports will be the NonFarm Payrolls and unemployment data. If these figures fall short of forecasts again, the U.S. currency could quickly return to the descending channel. However, before these data are released, we can expect a further fall in the pair, not the dollar. No important reports were published on Monday, so low volatility and the flat phase were understandable. But starting today, important data will be released in the U.S., so we can anticipate improved trading conditions.
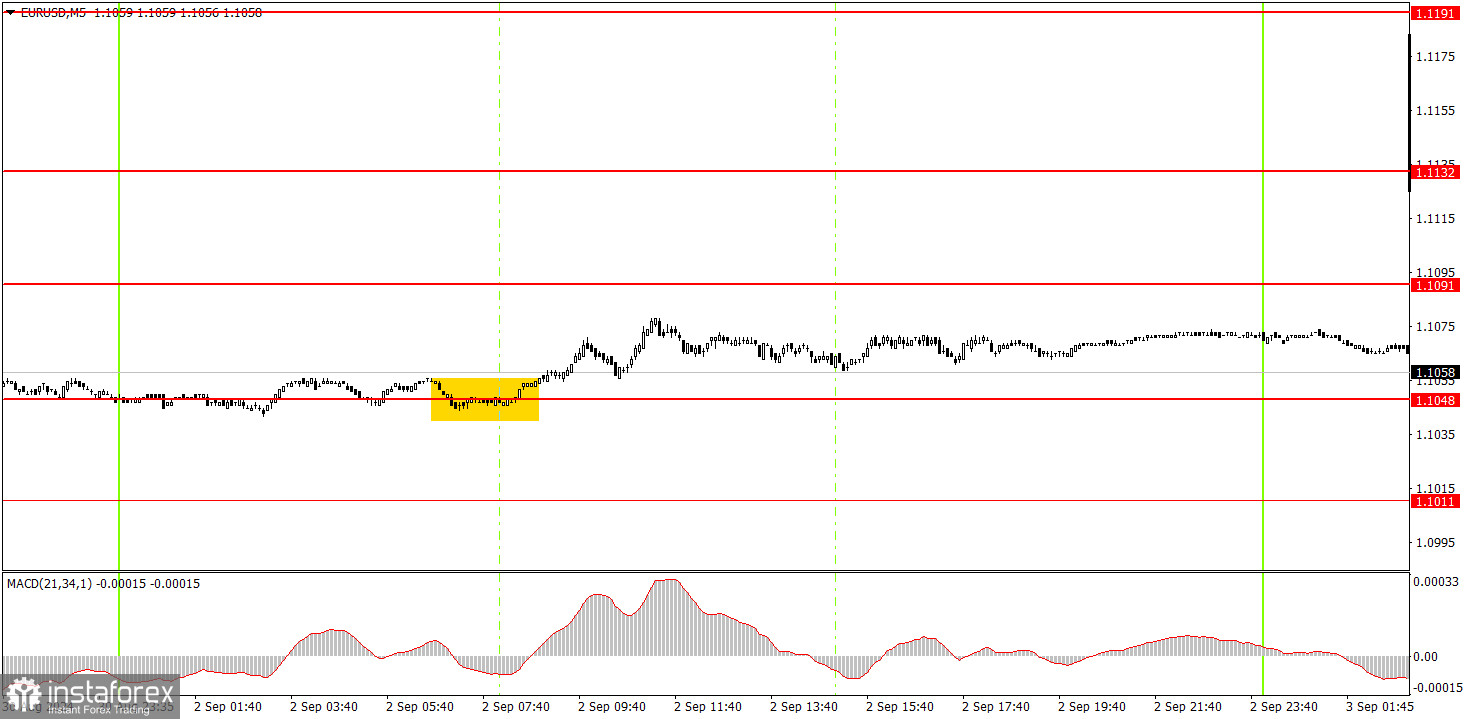
One trading signal was generated in the 5-minute time frame on Monday. At the start of the European session, the price bounced off the 1.1048 level and then rose by about 10-15 pips. It didn't reach the nearest target at 1.1091, but novice traders could have manually closed the trade with a profit towards the evening.
In the hourly time frame, the EUR/USD pair has settled below the ascending trend line and, for the first time in a long while, has a chance to form a downward trend that would be logical and consistent with all factors and types of analysis. Unfortunately, illogical dollar sales could quickly resume after a downward correction, as no one knows how long the market will continue to price in the Federal Reserve's monetary policy easing, which has yet to start. However, the fact remains that the market continues to price in nearly all future Fed rate cuts into the dollar.
On Tuesday, novice traders might expect a further decline if the price consolidates below the 1.1048 level or bounces off the 1.1091 level. We remain skeptical about buying.
The key levels to consider on the 5M time frame are 1.0726-1.0733, 1.0797-1.0804, 1.0838-1.0856, 1.0888-1.0896, 1.0940, 1.0971, 1.1011, 1.1048, 1.1091, 1.1132, 1.1191, 1.1275-1.1292. No significant events are scheduled in the Eurozone for Tuesday, while in the U.S., the ISM Manufacturing PMI, a fairly significant index, will be released. The market is likely to react to this report. The dollar needs a strong reading.
1) The strength of a signal is determined by the time it takes for the signal to form (bounce or level breakthrough). The less time it took, the stronger the signal.
2) If two or more trades around a certain level are initiated based on false signals, subsequent signals from that level should be ignored.
3) In a flat market, any currency pair can form multiple false signals or none at all. In any case, it's better to stop trading at the first signs of a flat market.
4) Trades should be opened between the start of the European session and midway through the U.S. session. After this period, all trades must be closed manually.
5) In the hourly time frame, trades based on MACD signals are only advisable amidst substantial volatility and an established trend confirmed by a trendline or trend channel.
6) If two levels are too close to each other (5 to 20 pips), they should be considered support or resistance.
7) After moving 15 pips in the intended direction, the Stop Loss should be set to break even.
Support and Resistance price levels: targets for opening long or short positions. You can place Take Profit levels near them.
Red lines: channels or trend lines that depict the current trend and indicate the preferred trading direction.
The MACD (14,22,3) indicator, encompassing both the histogram and signal line, acts as an auxiliary tool and can also be used as a source of signals.
Important speeches and reports (always noted in the news calendar) can profoundly influence the movement of a currency pair. Hence, trading during their release calls for heightened caution. It may be reasonable to exit the market to prevent abrupt price reversals against the prevailing trend.
Beginners should always remember that not every trade will yield profit. Developing a clear strategy and effective money management is key to success in trading over a long period.
InstaForex analytical reviews will make you fully aware of market trends! Being an InstaForex client, you are provided with a large number of free services for efficient trading.


