 Zostať
Podmienky obchodovania
Nástroje


Pár GBP/USD aj vo štvrtok vykazoval silný rast napriek tomu, že na to nemal žiadne dôvody. Zatiaľ čo zasadnutie Európskej centrálnej banky mohlo euro hypoteticky podporiť, v Spojenom kráľovstve sa neuskutočnili žiadne významné spravodajské udalosti. V USA bol zverejnený index cien výrobcov, ktorý bol v medzimesačnom vyjadrení o 0,1 % vyšší, ako sa predpokladalo. Verí niekto úprimne, že tento index vyvolal 100-pipový pokles dolára?
Aký máme výsledok? Včera trh opäť predviedol "klasiku roku 2024" - britská libra bezdôvodne vzrástla. Stále je možné predpokladať, že klesajúci trend bude trvať aj naďalej a pokles bude pokračovať. Už teraz je však jasné, že trh stále nemá chuť nakupovať americký dolár. Zdá sa, že všetko smeruje k pokračovaniu už dva roky trvajúceho rastúceho trendu a analytici budú opäť hovoriť o "náraste rizikového sentimentu".
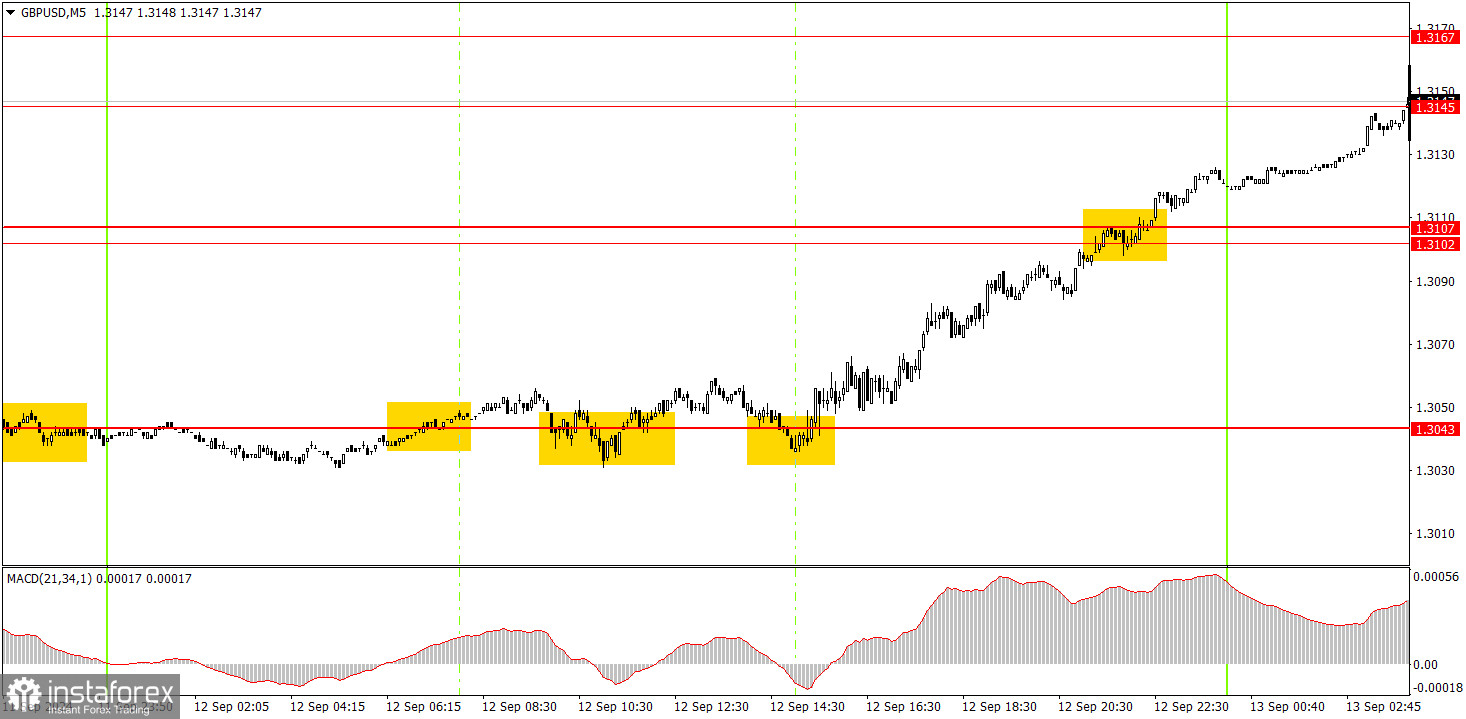
Vo štvrtok sa na 5-minútovom grafe vytvorili tri nákupné signály okolo úrovne 1,3043. Keďže sa všetky navzájom duplikovali, mala byť otvorená len jedna dlhá pozícia. Následne sa cena dostala do oblasti 1,3102 - 1,3107 a dokonca ju prelomila. V súčasnosti sa pohyb zastavil v blízkosti úrovne 1,3145. Začínajúci obchodníci mohli svoje dlhé pozície zavrieť takmer v ktoromkoľvek momente počas americkej seansy - bez ohľadu na to by boli ziskoví.
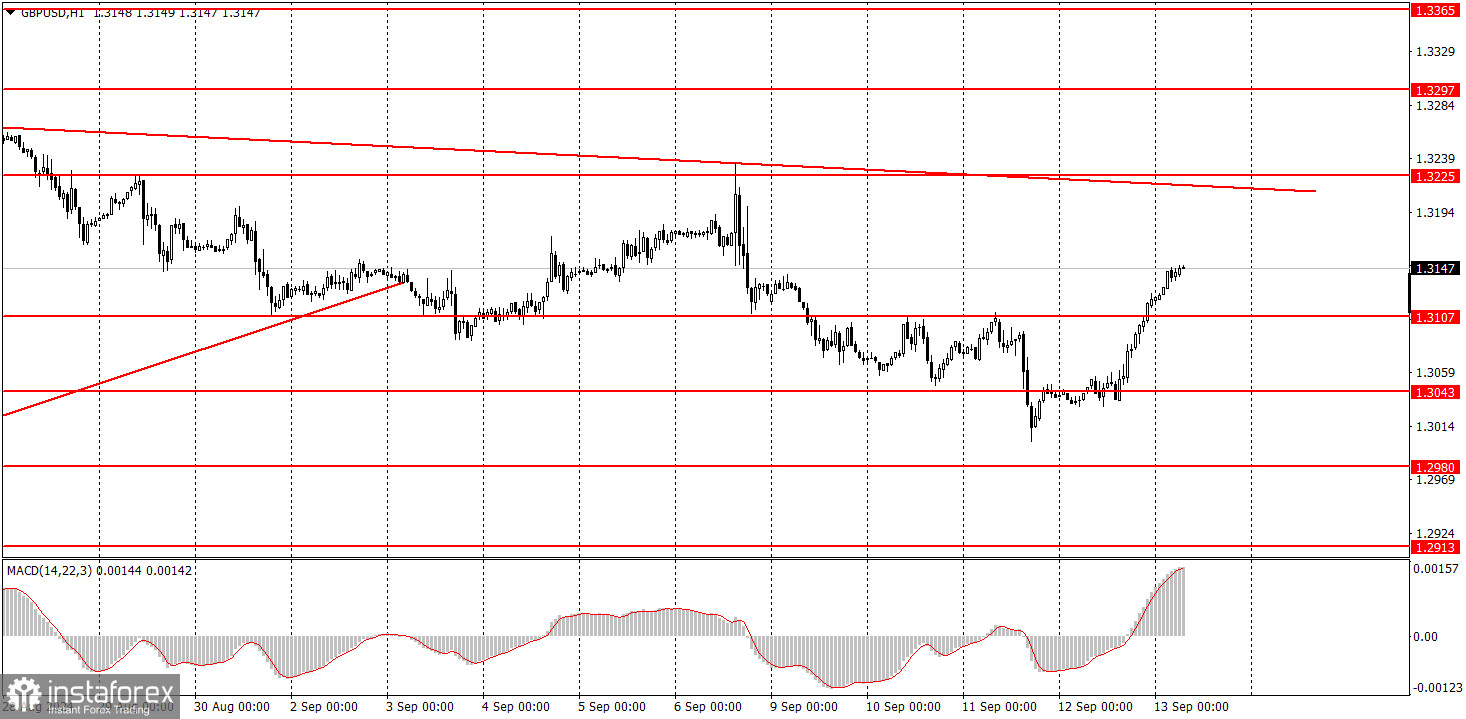
Klesajúci trend páru GBP/USD by sa na hodinovom grafe mohol obnoviť alebo by minimálne mohlo dôjsť k výraznej korekcii. Britská libra je stále prekúpená, zatiaľ čo dolár je podhodnotený, a trh je stále oveľa viac naklonený predaju dolára ako jeho nákupu. Libra zatiaľ vykazuje len menšiu medvediu korekciu. Na to, aby sme mohli hovoriť o plnohodnotnom klesajúcom trende, je ešte priskoro. Očakávané zasadnutie Fedu sa uskutoční budúci týždeň a po ňom bude možné vyvodiť závery o strednodobom smerovaní dolára.
V piatok by pokles páru mohol pokračovať bez zjavného dôvodu. Trh však aj naďalej ukazuje, že je pripravený kupovať libru aj bez opodstatnenia.
Kľúčové úrovne na 5-minútovom grafe sú 1,2605 ‒ 1,2633, 1,2684 ‒1,2693, 1,2748, 1,2791 ‒ 1,2798, 1,2848 ‒ 1,2860, 1,2913, 1,2980 ‒ 1,2993, 1,3043, 1,3102 ‒ 1,3107, 1,3145 ‒1,3167, 1,3225, 1,3272 a 1,3310. V Spojenom kráľovstve nie sú na piatok naplánované žiadne významné udalosti a v USA bude zverejnený len index spotrebiteľského sentimentu Michiganskej univerzity. Dnešné obchodovanie by malo vychádzať z technickej analýzy.
1) Sila signálu sa určuje podľa času, ktorý je potrebný na jeho vytvorenie (buď odrazom alebo prelomením úrovne). Ak signál vznikne za kratší čas, znamená to, že je silnejší.
2) Ak sa na základe falošných signálov otvoria na určitej úrovni dva alebo viac obchodov, následné signály z tejto úrovne by sa nemali brať do úvahy.
3) Na trhu bez jednoznačného trendu môže akýkoľvek menový pár vytvoriť viacero falošných signálov alebo žiadny signál. V každom prípade trh bez trendu nepatrí medzi vhodné podmienky na obchodovanie.
4) Obchodné aktivity sa vykonávajú od začiatku európskej seansy do polovice americkej seansy, po ktorej by sa mali všetky otvorené obchody ručne zavrieť.
5) Otvoriť obchody na základe signálov MACD na 30-minútovom grafe sa odporúča, len ak je na trhu značná volatilita a ustálený trend, ktorý je potvrdený buď trendovou čiarou, alebo trendovým kanálom.
6) Ak dve úrovne ležia tesne vedľa seba (v rozmedzí 5 až 15 pipov), mali by sa považovať za zónu podpory alebo rezistencie.
7) Po pohybe 15 pipov v predpokladanom smere by mal byť stop loss nastavený na hranicu rentability.
Cenové úrovne podpory a rezistencie môžu slúžiť ako ciele pri nákupe alebo predaji. Do ich blízkosti môžete umiestniť úrovne take profit.
Červené čiary predstavujú kanály alebo trendové čiary, ktoré znázorňujú aktuálny trend na trhu a naznačujú očakávaný smer obchodovania.
Indikátor MACD (14,22,3), ktorý zahŕňa histogram aj signálnu čiaru, slúži ako pomocný nástroj a možno ho použiť aj ako zdroj signálov.
Významné prejavy a správy (vždy zaznamenané v kalendári správ) môžu zásadne ovplyvniť dynamiku cien. Preto si obchodovanie počas ich zverejnenia vyžaduje zvýšenú opatrnosť. Môže byť rozumné opustiť trh, aby sa zabránilo náhlym cenovým obratom proti prevládajúcemu trendu.
Začiatočníci by mali mať vždy na pamäti, že nie každý obchod prinesie zisk. Základom trvalého obchodného úspechu je stanovenie jasnej stratégie spolu s rozumným riadením peňazí.
InstaForex analytical reviews will make you fully aware of market trends! Being an InstaForex client, you are provided with a large number of free services for efficient trading.


