 Zostať
Podmienky obchodovania
Nástroje


1-hodinový graf páru EUR/USD
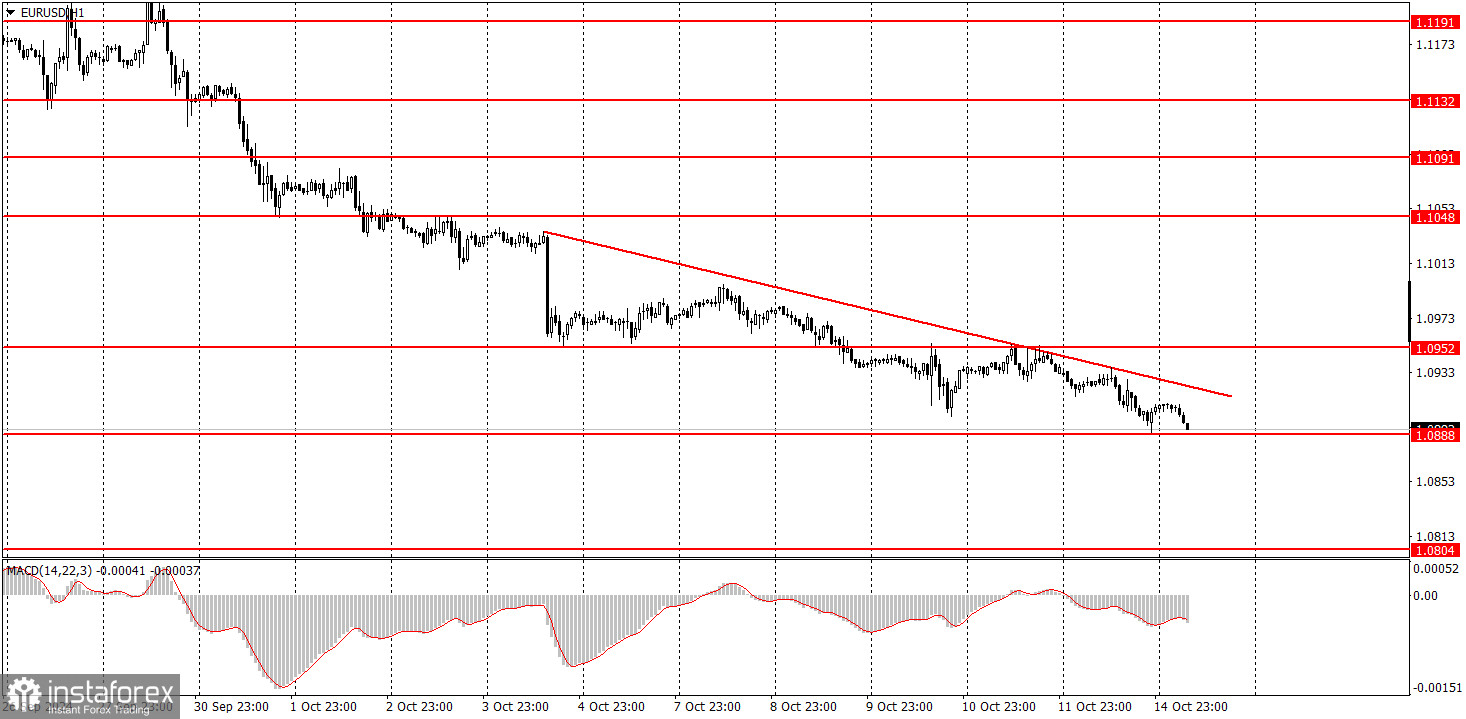
V pondelok pár EUR/USD naďalej klesal. Pokles pretrvával aj v noci na utorok, a to napriek tomu, že v pondelok neboli zverejnené žiadne správy z EÚ ani USA a v týchto krajinách sa neudiali žiadne významné udalosti. Euro však naďalej pokračovalo v dennom poklese. Pokles je postupný a stabilný a volatilita je nízka. Tento pohyb nás neprekvapuje, keďže sme dlhodobo poukazovali na to, že euro je prekúpené a neodôvodnene drahé. Preto sa nám takmer každodenný pokles eura zdá logický. Trh už zohľadnil celý cyklus uvoľňovania menovej politiky Federálneho rezervného systému a teraz, keď sa tento cyklus začal, už nie je dôvod dolár predávať. Navyše sa zdá, že trh úplne zabudol, že ECB tiež znižuje sadzby a tento týždeň tak možno urobí už tretíkrát. Z nášho pohľadu by mal tento pár v strednodobom horizonte naďalej klesať.
5-minútový graf páru EUR/USD
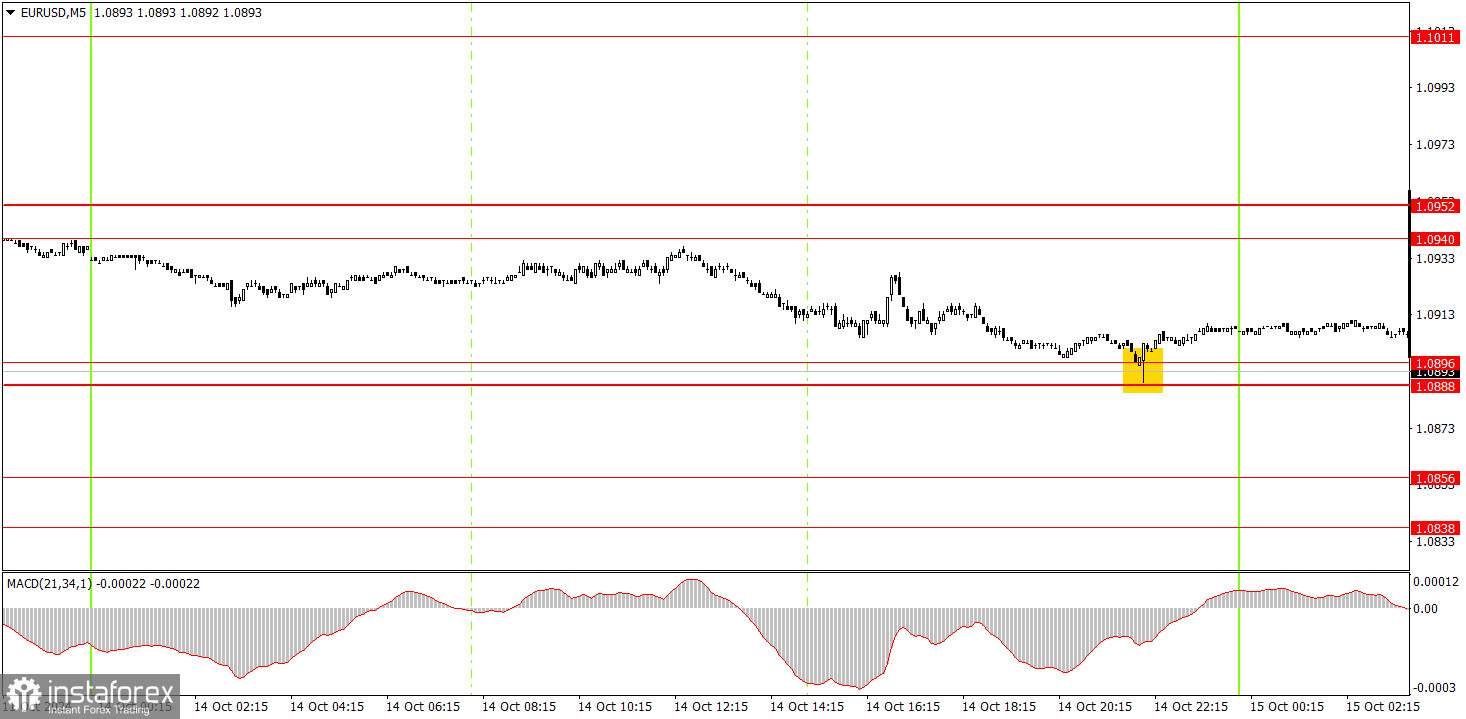
Na 5-minútovom grafe sa v pondelok neskoro večer vytvoril nákupný signál, ktorý nebol zaujímavý. V piatok cena dvakrát otestovala oblasť úrovní 1,0940 - 1,0951, no v pondelok sa jej to nepodarilo, a preto sa neobjavili žiadne predajné signály. Nákupné signály nás veľmi nezaujali ani počas denných poklesov páru. Je len málo dôvodov na nákup, keď väčšina obchodníkov predáva.
Obchodné tipy na utorok:
Pár EUR/USD sa minulý týždeň na hodinovom grafe výrazne priblížil k novému klesajúcemu trendu. Nanešťastie, neočakávaný predaj dolára by mohol v strednodobom horizonte pokračovať, keďže nikto nevie, ako dlho bude trh ešte reagovať na uvoľňovanie menovej politiky Fedu. Pár má však na hodinovom grafe ešte stále klesajúci trend. Očakávame, že euro bude pokračovať v poklese aj bez korekcie, keďže zostáva vysoko prekúpené. Korekcia by však bola estetickejšia.
V utorok môžete obchodovať v oblasti úrovní 1,0888 ‒ 1,0896. Pohyby budú pravdepodobne opäť slabé, takže neočakávame vysoké zisky.
Kľúčové úrovne na 5-minútovom grafe sú 1,0726 ‒ 1,0733, 1,0797 ‒ 1,0804, 1,0838 ‒ 1,0856, 1,0888 ‒ 1,0896, 1,0940 ‒ 1,0951, 1,1011, 1,1048, 1,1091, 1,1132 ‒ 1,1140, 1,1189 ‒ 1,1191. V utorok bude zverejnená len správa o priemyselnej výrobe EÚ, ktorá pravdepodobne výrazne neovplyvní chuť trhu aktívne obchodovať.
Základné pravidlá obchodovania:
1. Sila signálu sa určuje podľa času, ktorý je potrebný na jeho vytvorenie (buď odrazom alebo prelomením úrovne). Ak signál vznikne za kratší čas, znamená to, že je silnejší.
2. Ak sa na základe falošných signálov otvoria na určitej úrovni dva alebo viac obchodov, následné signály z tejto úrovne by sa nemali brať do úvahy.
3. Na trhu bez jednoznačného trendu môže akýkoľvek menový pár vytvoriť viacero falošných signálov alebo žiadny signál. V každom prípade trh bez trendu nepatrí medzi vhodné podmienky na obchodovanie.
4. Obchodné aktivity sa vykonávajú od začiatku európskej seansy do polovice americkej seansy, po ktorej by sa mali všetky otvorené obchody ručne zavrieť.
5. Otvoriť obchody na základe signálov MACD na 30-minútovom grafe sa odporúča, len ak je na trhu značná volatilita a ustálený trend, ktorý je potvrdený buď trendovou čiarou, alebo trendovým kanálom.
6. Ak dve úrovne ležia tesne vedľa seba (v rozmedzí 5 až 15 pipov), mali by sa považovať za zónu podpory alebo rezistencie.
7. Po pohybe 15 pipov v predpokladanom smere by mal byť stop loss nastavený na bod vstupu na trh.
Ako interpretovať grafy:
Významné prejavy a správy (vždy zaznamenané v kalendári správ) môžu zásadne ovplyvniť dynamiku cien. Preto si obchodovanie počas ich zverejnenia vyžaduje zvýšenú opatrnosť. Môže byť rozumné opustiť trh, aby sa zabránilo náhlym cenovým obratom proti prevládajúcemu trendu.
Začiatočníci by mali mať vždy na pamäti, že nie každý obchod prinesie zisk. Základom trvalého obchodného úspechu je stanovenie jasnej stratégie spolu s rozumným riadením peňazí.
InstaForex analytical reviews will make you fully aware of market trends! Being an InstaForex client, you are provided with a large number of free services for efficient trading.


