
 Zostať

Formácie sú grafické modely, ktoré v grafe vytvára pohyb ceny. Jedným z postulátov technickej analýzy je, že história (pohyb ceny) sa opakuje. Znamená to, že pohyby ceny sú v rovnakých situáciách často podobné, čo umožňuje s vysokou pravdepodobnosťou predpovedať ďalší vývoj situácie.
Služba Aktuálne formácie od InstaForexu sa ľahko používa. Vďaka nej sa dozviete o aktuálnych zmenách na trhu a budete tak môcť včas zareagovať na signály trhu. Táto služba vám vždy prinesie informácie o najnovších a najdôležitejších formáciách každého páru v ľubovoľnom časovom rámci.
was formed on 20.03 at 04:25:18 (UTC+0)
signal strength 1 of 5
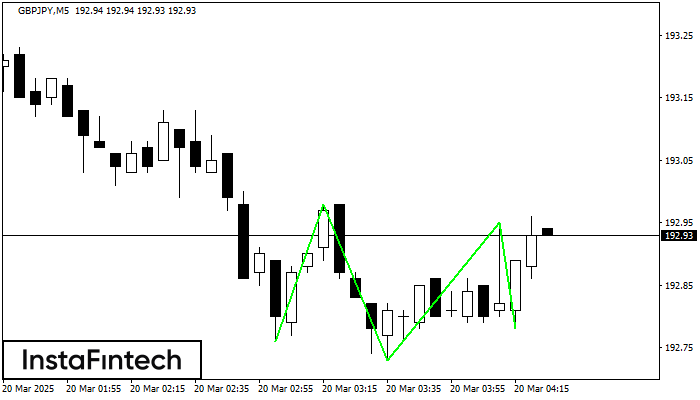
The Triple Bottom pattern has been formed on GBPJPY M5. It has the following characteristics: resistance level 192.98/192.95; support level 192.76/192.78; the width is 22 points. In the event of a breakdown of the resistance level of 192.98, the price is likely to continue an upward movement at least to 192.88.
The M5 and M15 time frames may have more false entry points.


