
 Zostať


Formácie sú grafické modely, ktoré v grafe vytvára pohyb ceny. Jedným z postulátov technickej analýzy je, že história (pohyb ceny) sa opakuje. Znamená to, že pohyby ceny sú v rovnakých situáciách často podobné, čo umožňuje s vysokou pravdepodobnosťou predpovedať ďalší vývoj situácie.
Služba Aktuálne formácie od InstaForexu sa ľahko používa. Vďaka nej sa dozviete o aktuálnych zmenách na trhu a budete tak môcť včas zareagovať na signály trhu. Táto služba vám vždy prinesie informácie o najnovších a najdôležitejších formáciách každého páru v ľubovoľnom časovom rámci.
was formed on 25.03 at 04:00:34 (UTC+0)
signal strength 2 of 5
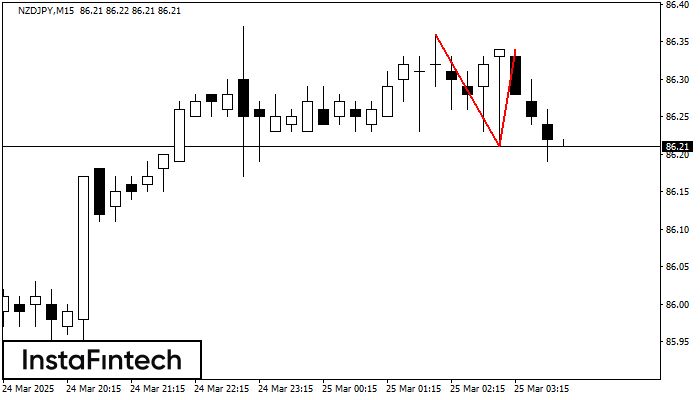
On the chart of NZDJPY M15 the Double Top reversal pattern has been formed. Characteristics: the upper boundary 86.34; the lower boundary 86.21; the width of the pattern 13 points. The signal: a break of the lower boundary will cause continuation of the downward trend targeting the 85.99 level.
The M5 and M15 time frames may have more false entry points.
Pozrite si tiež
- All
- Double Top
- Flag
- Head and Shoulders
- Pennant
- Rectangle
- Triangle
- Triple top
- All
- #AAPL
- #AMZN
- #EBAY
- #FB
- #GOOG
- #INTC
- #KO
- #MA
- #MCD
- #MSFT
- #NTDOY
- #PEP
- #TSLA
- #TWTR
- AUDCAD
- AUDCHF
- AUDJPY
- AUDUSD
- EURCAD
- EURCHF
- EURGBP
- EURJPY
- EURNZD
- EURRUB
- EURUSD
- GBPAUD
- GBPCHF
- GBPJPY
- GBPUSD
- GOLD
- NZDCAD
- NZDCHF
- NZDJPY
- NZDUSD
- SILVER
- USDCAD
- USDCHF
- USDJPY
- USDRUB
- All
- M5
- M15
- M30
- H1
- D1
- All
- Buy
- Sale
- All
- 1
- 2
- 3
- 4
- 5
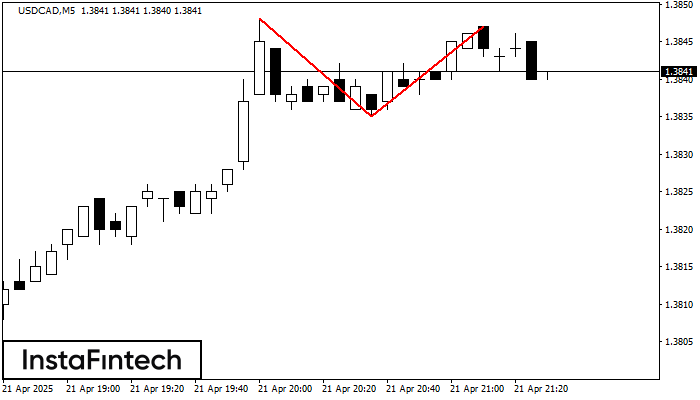
El patrón Doble Techo ha sido formado en USDCAD M5. Esto señala que la tendencia ha sido cambiada de alcista a bajista. Probablemente, si la base del patrón 1.3835
Los marcos de tiempo M5 y M15 pueden tener más puntos de entrada falsos.
Open chart in a new window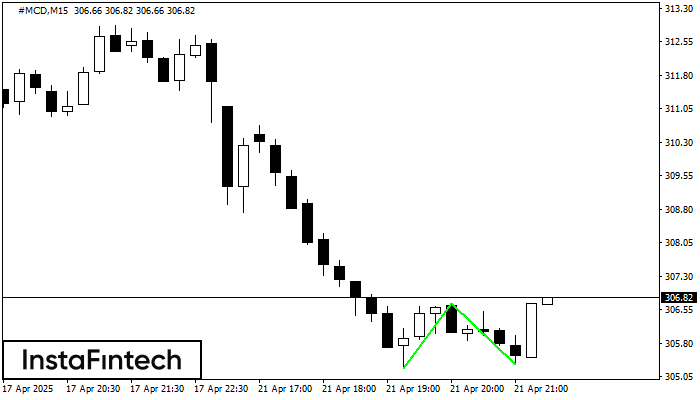
El patrón Doble Piso ha sido formado en #MCD M15. Características: el nivel de soporte 305.24; el nivel de resistencia 306.70; el ancho del patrón 146 puntos. Si el nivel
Los marcos de tiempo M5 y M15 pueden tener más puntos de entrada falsos.
Open chart in a new window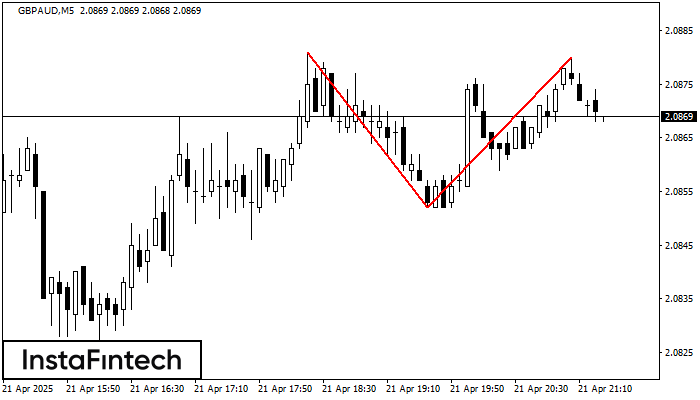
En el gráfico de GBPAUD M5 el patrón de reversión Doble Techo ha sido formado. Características: límite superior 2.0880; límite inferior 2.0852; el ancho del patrón 28 puntos. La señal
Los marcos de tiempo M5 y M15 pueden tener más puntos de entrada falsos.
Open chart in a new window


