
 Zostať

Formácie sú grafické modely, ktoré v grafe vytvára pohyb ceny. Jedným z postulátov technickej analýzy je, že história (pohyb ceny) sa opakuje. Znamená to, že pohyby ceny sú v rovnakých situáciách často podobné, čo umožňuje s vysokou pravdepodobnosťou predpovedať ďalší vývoj situácie.
Služba Aktuálne formácie od InstaForexu sa ľahko používa. Vďaka nej sa dozviete o aktuálnych zmenách na trhu a budete tak môcť včas zareagovať na signály trhu. Táto služba vám vždy prinesie informácie o najnovších a najdôležitejších formáciách každého páru v ľubovoľnom časovom rámci.
was formed on 28.03 at 06:01:22 (UTC+0)
signal strength 1 of 5
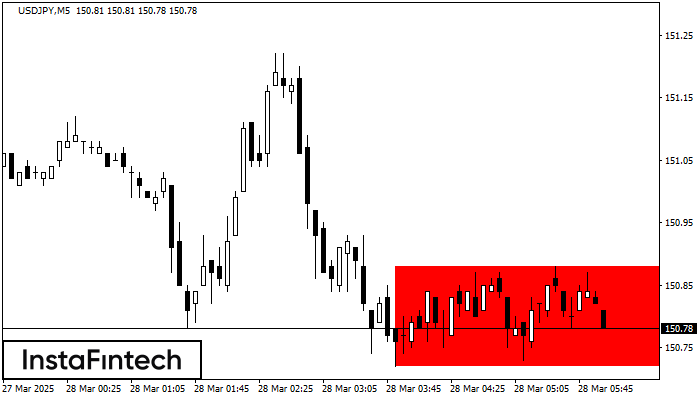
According to the chart of M5, USDJPY formed the Bearish Rectangle. This type of a pattern indicates a trend continuation. It consists of two levels: resistance 150.88 - 0.00 and support 150.72 – 150.72. In case the resistance level 150.72 - 150.72 is broken, the instrument is likely to follow the bearish trend.
The M5 and M15 time frames may have more false entry points.
Pozrite si tiež
- All
- Double Top
- Flag
- Head and Shoulders
- Pennant
- Rectangle
- Triangle
- Triple top
- All
- #AAPL
- #AMZN
- #EBAY
- #FB
- #GOOG
- #INTC
- #KO
- #MA
- #MCD
- #MSFT
- #NTDOY
- #PEP
- #TSLA
- #TWTR
- AUDCAD
- AUDCHF
- AUDJPY
- AUDUSD
- EURCAD
- EURCHF
- EURGBP
- EURJPY
- EURNZD
- EURRUB
- EURUSD
- GBPAUD
- GBPCHF
- GBPJPY
- GBPUSD
- GOLD
- NZDCAD
- NZDCHF
- NZDJPY
- NZDUSD
- SILVER
- USDCAD
- USDCHF
- USDJPY
- USDRUB
- All
- M5
- M15
- M30
- H1
- D1
- All
- Buy
- Sale
- All
- 1
- 2
- 3
- 4
- 5

Secondo il grafico di M5, GBPCHF ha formato il modello Triangolo Simmetrico Ribassista. Raccomandazioni di trading: Una rottura del confine inferiore 1.0783 rischia di incoraggiare una continuazione del trend discendente
I time frame M5 e M15 possono avere più punti di ingresso falsi.
Open chart in a new window
Il modello Triplo Minimo si è formato sul grafico M15 del USDJPY. Caratteristiche del modello: La linea inferiore del modello ha coordinate 140.99 con il confine superiore 140.99/140.92, la proiezione
I time frame M5 e M15 possono avere più punti di ingresso falsi.
Open chart in a new window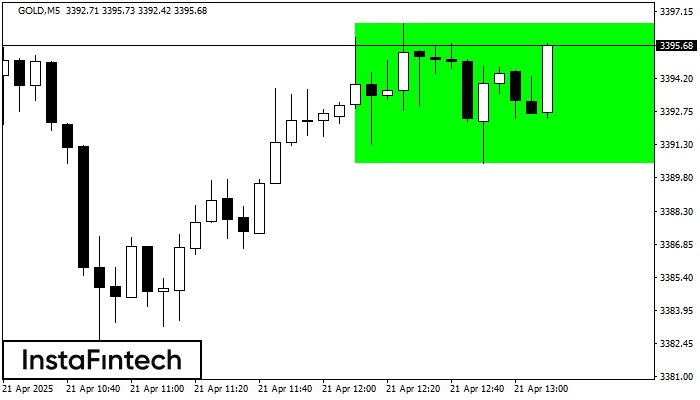
Secondo il grafico di M5, GOLD ha formato il Rettangolo Rialzista. Questo tipo di modello indica una continuazione di trend. Consiste di due livelli: resistenza 3396.64 e supporto 3390.42
I time frame M5 e M15 possono avere più punti di ingresso falsi.
Open chart in a new window

