
 Zostať

Formácie sú grafické modely, ktoré v grafe vytvára pohyb ceny. Jedným z postulátov technickej analýzy je, že história (pohyb ceny) sa opakuje. Znamená to, že pohyby ceny sú v rovnakých situáciách často podobné, čo umožňuje s vysokou pravdepodobnosťou predpovedať ďalší vývoj situácie.
Služba Aktuálne formácie od InstaForexu sa ľahko používa. Vďaka nej sa dozviete o aktuálnych zmenách na trhu a budete tak môcť včas zareagovať na signály trhu. Táto služba vám vždy prinesie informácie o najnovších a najdôležitejších formáciách každého páru v ľubovoľnom časovom rámci.
was formed on 04.04 at 11:25:26 (UTC+0)
signal strength 1 of 5
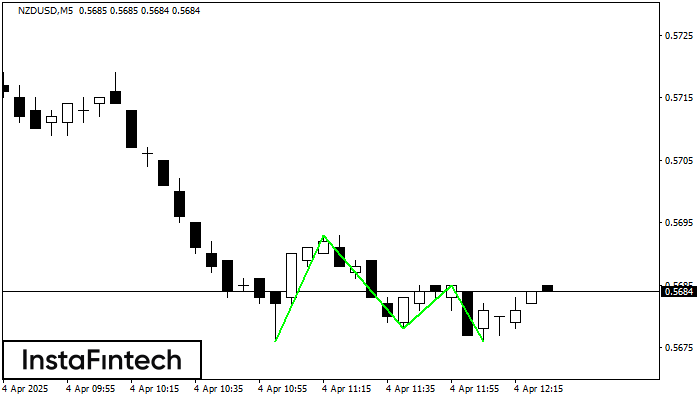
The Triple Bottom pattern has been formed on NZDUSD M5. It has the following characteristics: resistance level 0.5693/0.5685; support level 0.5676/0.5676; the width is 17 points. In the event of a breakdown of the resistance level of 0.5693, the price is likely to continue an upward movement at least to 0.5693.
The M5 and M15 time frames may have more false entry points.
Pozrite si tiež
- All
- Double Top
- Flag
- Head and Shoulders
- Pennant
- Rectangle
- Triangle
- Triple top
- All
- #AAPL
- #AMZN
- #EBAY
- #FB
- #GOOG
- #INTC
- #KO
- #MA
- #MCD
- #MSFT
- #NTDOY
- #PEP
- #TSLA
- #TWTR
- AUDCAD
- AUDCHF
- AUDJPY
- AUDUSD
- EURCAD
- EURCHF
- EURGBP
- EURJPY
- EURNZD
- EURRUB
- EURUSD
- GBPAUD
- GBPCHF
- GBPJPY
- GBPUSD
- GOLD
- NZDCAD
- NZDCHF
- NZDJPY
- NZDUSD
- SILVER
- USDCAD
- USDCHF
- USDJPY
- USDRUB
- All
- M5
- M15
- M30
- H1
- D1
- All
- Buy
- Sale
- All
- 1
- 2
- 3
- 4
- 5

O padrão Fundo triplo foi formado no gráfico de AUDCHF M30. Características do padrão: A linha inferior do padrão tem coordenadas 0.5232 com o limite superior 0.5232/0.5218, a projeção
Open chart in a new window
O padrão de reversão Topo duplo foi formado em #Bitcoin M5. Características: o limite superior 85197.81; o limite inferior 84993.66; a largura do padrão é de 23229 pontos. As operações
Os intervalos M5 e M15 podem ter mais pontos de entrada falsos.
Open chart in a new window
De acordo com o gráfico de M5, #Bitcoin formou Retângulo de baixa que é um padrão de uma continuação de tendência. O padrão está dentro dos seguintes limites: limite inferior
Os intervalos M5 e M15 podem ter mais pontos de entrada falsos.
Open chart in a new window


