 Permanecer
Condiciones de negociación
Products
Herramientas


On November 10, Gold (XAU / USD) broke sharply the strong resistance of 1,830-1,833 upwards. Above this level, it quickly accelerated its upward movement until reaching the high of 1,868.62.
Gold is forming a symmetrical triangle pattern. In the next few hours, it is expected to continue oscillating between the levels of 1,860-1,845. Besides, the support and resistance levels will be shortened.
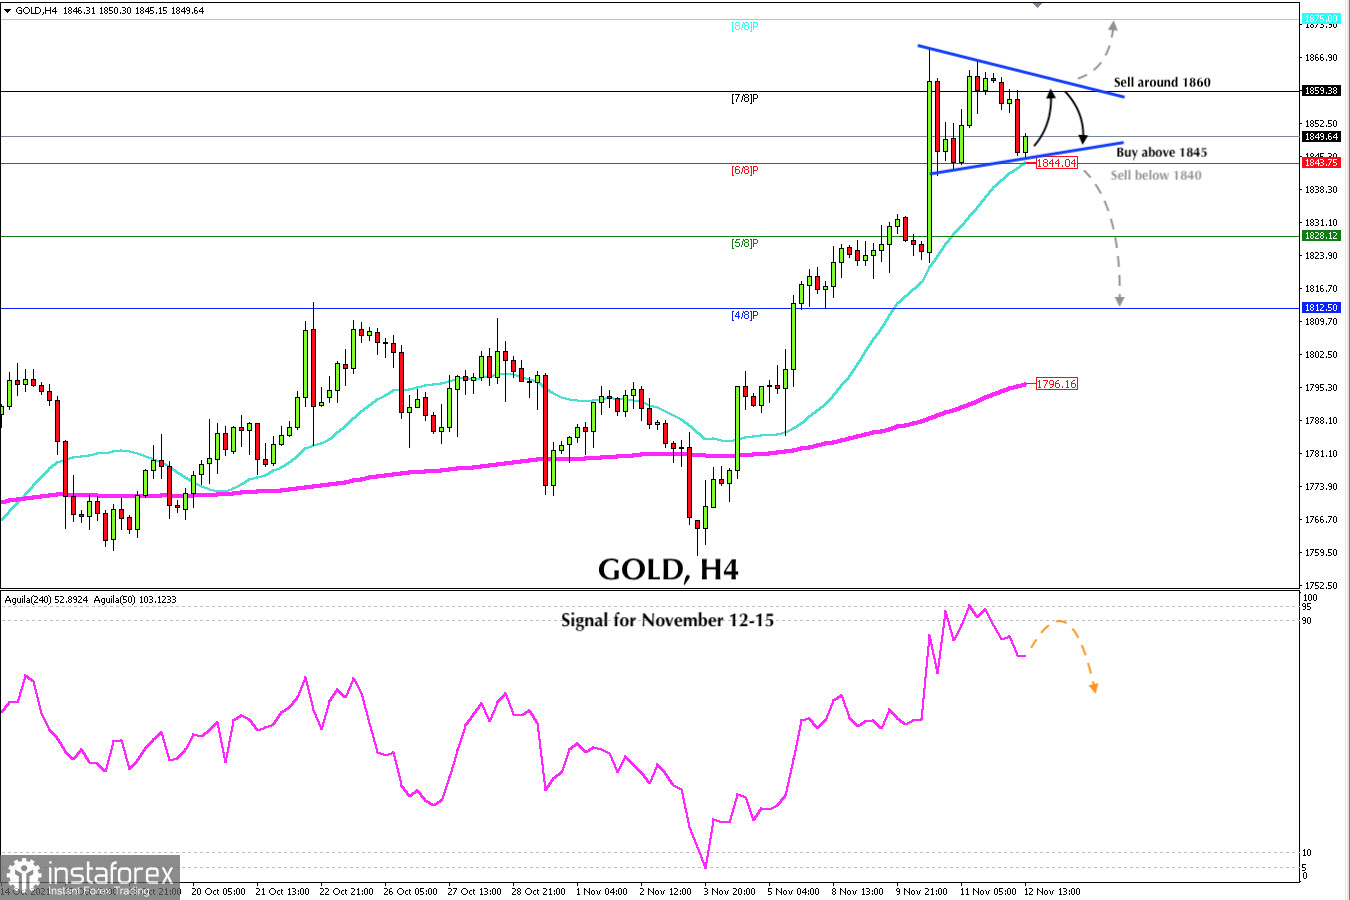
A decisive break above the symmetrical triangle could accelerate its bullish move to 8/8 of murray located at 1,875.
On the contrary, a break below the symmetrical triangle, the SMA of 21 and below 6/8 of murray could accelerate its downward movement and gold could fall to the level of 1,812 there is located 4/8 of murray which represents a strong daily support.
We must remember that 1,830 on previous occasions has acted as strong resistance. Now it has become the key support. A pullback towards this zone is expected to give gold a strong bounce, hence we will have an opportunity to buy again.
A confirmation of this bearish movement will only occur when the symmetrical triangle pattern breaks below 1,844. This decline could enable a bearish signal and it will be time to sell. On the contrary, a bullish confirmation will occur when gold consolidates above 1,860 and breaks the symmetrical triangle pattern.
According to the 4-hour chart, the eagle indicator on November 11 reached the extremely overbought level around 95 points. Every time it reaches this level, the price makes an imminent correction. This is what happened with gold and we saw a fall to the level of 1,846. The strategy would be to monitor the support of 1,845 as the decline to the 1,830 level could accelerate.
Support and Resistance Levels for November 12 - 15, 2021
Resistance (3) 1,875
Resistance (2) 1,870
Resistance (1) 1,857
----------------------------
Support (1) 1,847
Support (2) 1,843
Support (3) 1,837
***********************************************************
A trading tip for GOLD for November 12 - 15, 2021
Sell below 1,860 (7/8) with take profit at 1,845 (6/8) and stop loss above 1,867.
¡Los informes analíticos de InstaForex lo mantendrá bien informado de las tendencias del mercado! Al ser un cliente de InstaForex, se le proporciona una gran cantidad de servicios gratuitos para una operación eficiente.

