 Permanecer
Condiciones de negociación
Products
Herramientas


Monday was traditionally accompanied by an absolutely empty macroeconomic calendar. Traders were focused on the information background, where the speech of ECB president Christine Lagarde provoked the euro's weakening. It is worth noting that her statements about inflationary expectations, as well as a slight increase in interest rates, upset investors.
Analysis of trading charts from November 15:
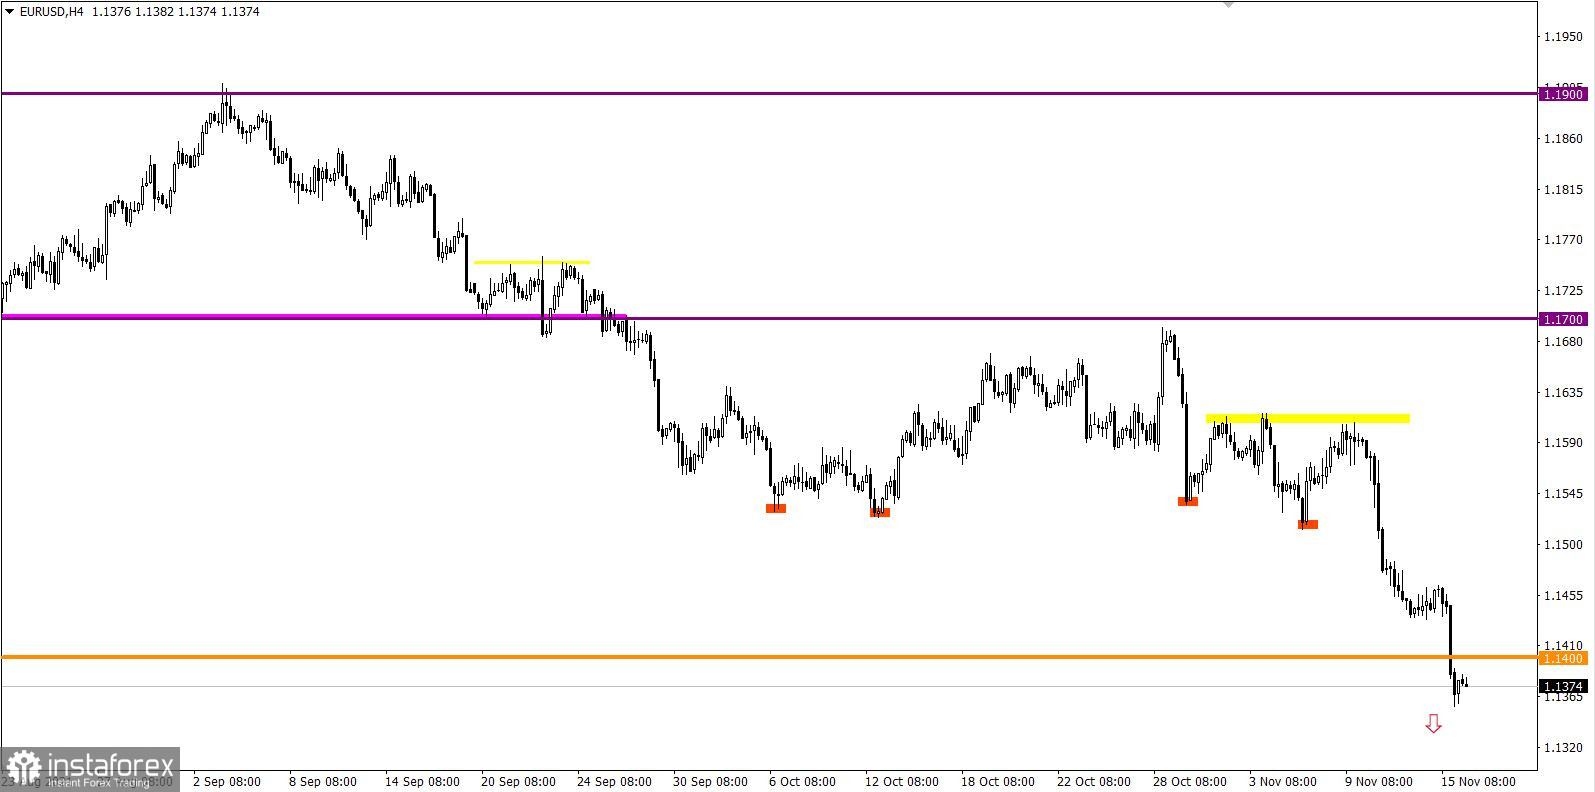
The European currency continued to decline against the US dollar after a short stagnation. As a result, the support level of 1.1400 was broken, and the quote dropped to the level of 1.1356.
Such a plot was expected in the market, so it was recommended earlier to enter into sell positions if the price is kept below the 1.1400 level.
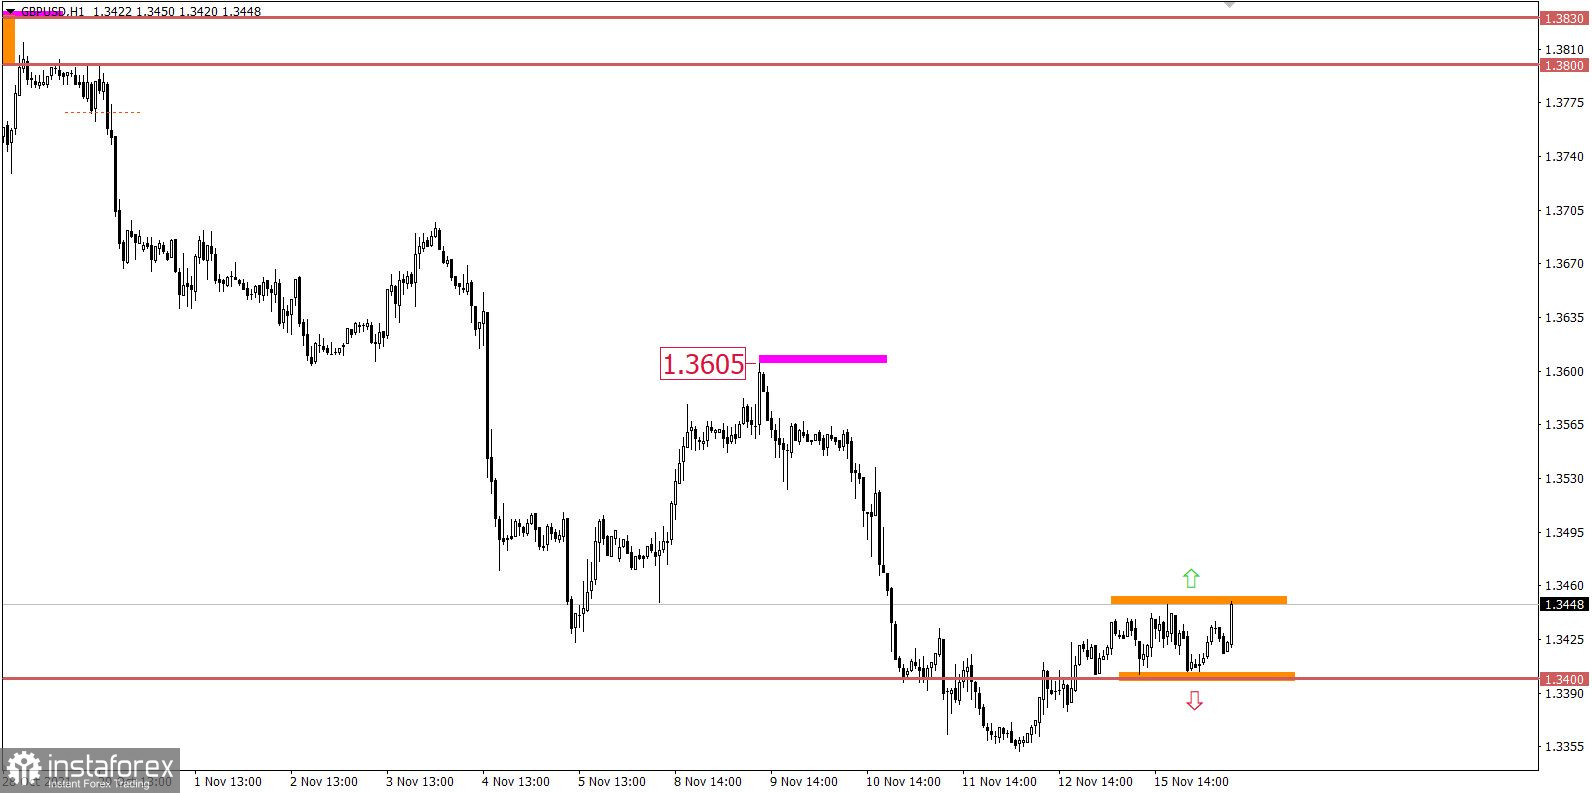
Unlike its counterpart in the market, the GBP/USD pair stood still, having an amplitude move within the borders of 1.3400/1.3450.
Selling positions were considered by the participants, but only after the price was kept below the 1.3400 mark. Thus, traders were outside the market yesterday, watching what was happening from the sidelines.

November 16 economic calendar:
The UK's labor market data was released today at 7:00 Universal time, where the unemployment rate declined from 4.5% to 4.3%. Meanwhile, employment in the country increased by 247 thousand during September.
The indicators for England are quite good, the pound sterling reacted to them with growth.
The next estimate of GDP for the 3rd quarter is expected to be published in Europe, where the indicator is likely to remain unchanged at 3.7%. This will not affect the market in any way if the statistics are confirmed.
At the same time, the United States will report on retail sales, the growth rate of which may slow from 13.9% to 12.0%. This is not the best signal for consumer activity in the country.
Trading plan for EUR/USD on November 16:
The quote may temporarily form a pullback towards the previously broken level of 1.1400 due to the euro's high oversold level. At the same time, the downward interest is actively supported by speculators. So, keeping the price below the level of 1.1350 may lead to a subsequent increase in the volume of short positions. This will open the way for sellers again.
Trading plan for GBP/USD on November 16:
It can be assumed that the price movement in the range of 1.3400/1.3450 will end soon. This will lead to a breakdown of one or another border with subsequent acceleration.
Trading recommendations:
What is reflected in the trading charts?
A candlestick chart view is graphical rectangles of white and black light, with sticks on top and bottom. When analyzing each candle in detail, you will see its characteristics of a relative period: the opening price, closing price, and maximum and minimum prices.
Horizontal levels are price coordinates, relative to which a stop or a price reversal may occur. These levels are called support and resistance in the market.
Circles and rectangles are highlighted examples where the price of the story unfolded. This color selection indicates horizontal lines that may put pressure on the quote in the future.
The up/down arrows are the reference points of the possible price direction in the future.
¡Los informes analíticos de InstaForex lo mantendrá bien informado de las tendencias del mercado! Al ser un cliente de InstaForex, se le proporciona una gran cantidad de servicios gratuitos para una operación eficiente.

