 Permanecer
Condiciones de negociación
Products
Herramientas


The UK's retail sales came out ahead of all forecasts. Here, the decline was replaced by an increase from -1.5% to 4.7%. Consumer activity data has increased markedly, which inspires optimism in the further growth of the British economy.
The pound was clearly overbought, as positive retail sales data did not support it in any way.
The Eurozone's inflation data was the primary event last Friday. The final data fully coincided with the preliminary estimate, reflecting the increase in consumer prices from 4.1% to 4.9%. It demonstrated the unusual behavior of the ECB again in terms of inaction in the face of rapidly growing inflation.
The reaction of the market to the statistics was in terms of speculative surges.
Analysis of trading charts from December 17:
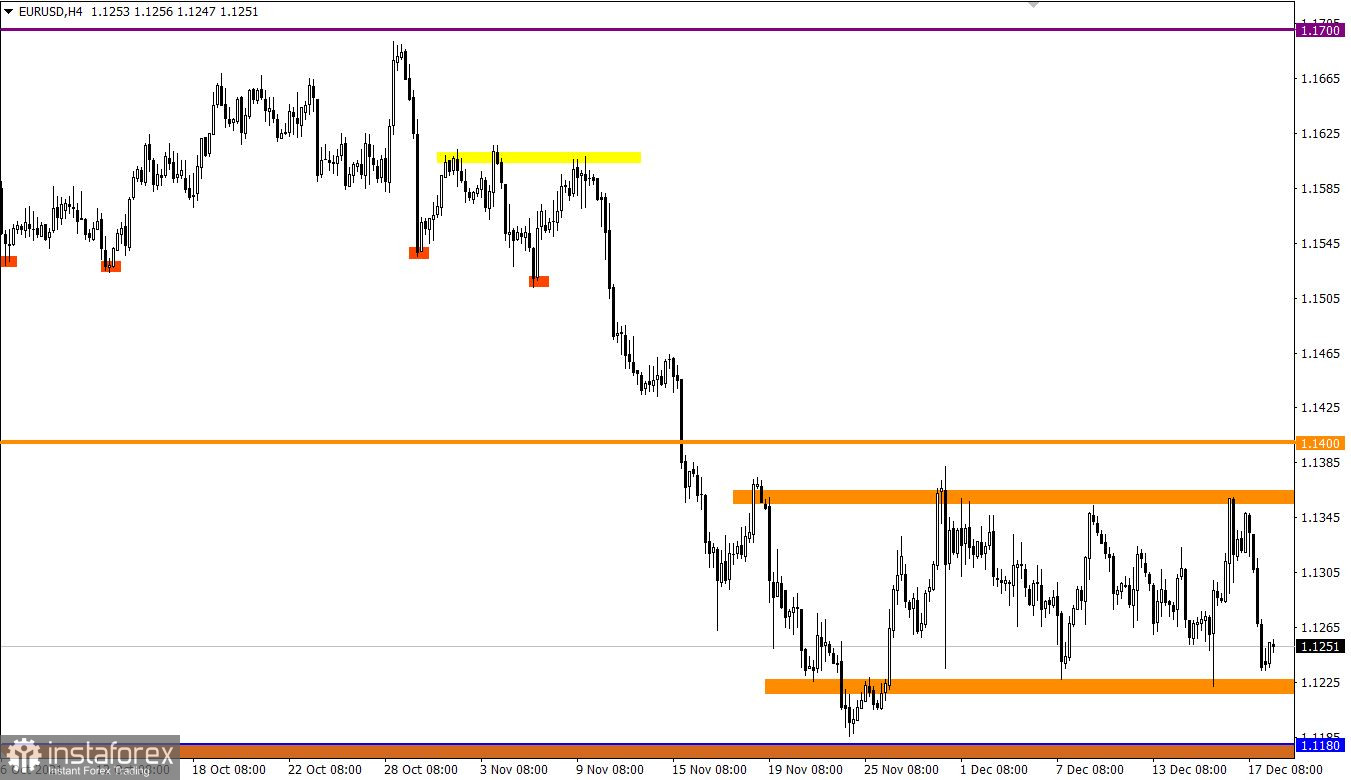
The EUR/USD pair rebounded accurately from the upper border of the side channel 1.1225/1.1355. This resulted in an increasing downward move, which returned the quote to the limit of the lower border of the flat. It is worth considering that the stagnation in the side channel has been taking place since the beginning of December, which has led to the accumulation of trading forces and, as a result, huge attention from speculators.
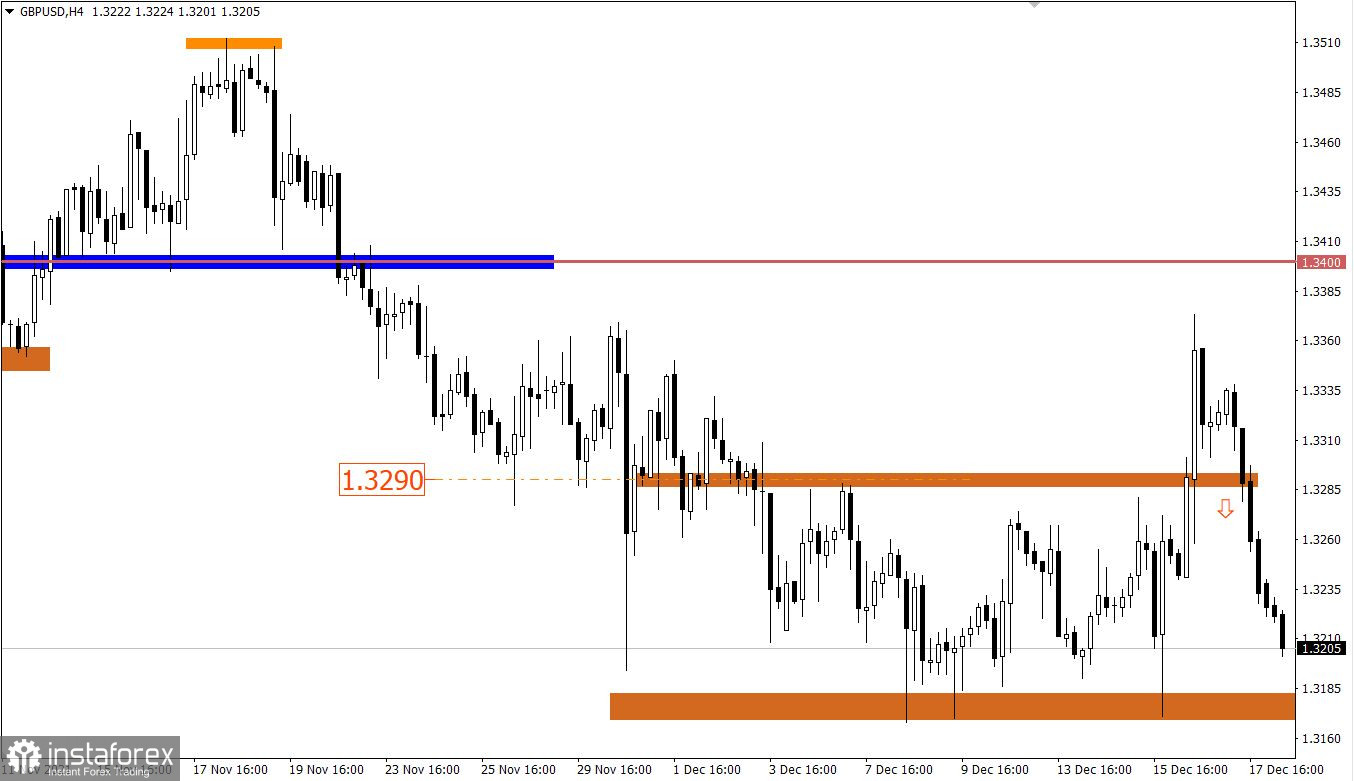
The GBP/USD pair is showing speculative interest due to the strong information and news flow. As a result, the quote initially rushed up by 150 points, and then returned to its original position. In this case, market participants found themselves again within the borders of the previously broken flat 1.3170/1.3290.

December 20 economic calendar:
Monday is traditionally accompanied by an empty macroeconomic calendar. Therefore, special attention is paid to the information flow and technical analysis.
Trading plan for EUR/USD on December 20:
In this situation, all traders' attention is focused on the side channel of 1.1225/1.1355, since the slowdown within the lower border may turn into a rebound stage. This will lead to the subsequent formation of the flat. The trading strategy on the breakdown of the flat will be considered only when the price is held outside a particular border in a four-hour period.
Trading plan for GBP/USD on December 20:
Since the quote has returned to the borders of the flat, it is impossible to rule out the continuation of a sideways move. This can lead to prolonged stagnation, at least until the end of the current year.
Traders will consider an alternative scenario if speculative interest does not leave the market. In this scenario, the flat will no longer play a key role.
What is reflected in the trading charts?
A candlestick chart view is graphical rectangles of white and black light, with sticks on top and bottom. When analyzing each candle in detail, you will see its characteristics of a relative period: the opening price, closing price, and maximum and minimum prices.
Horizontal levels are price coordinates, relative to which a stop or a price reversal may occur. These levels are called support and resistance in the market.
Circles and rectangles are highlighted examples where the price of the story unfolded. This color selection indicates horizontal lines that may put pressure on the quote in the future.
The up/down arrows are the reference points of the possible price direction in the future.
¡Los informes analíticos de InstaForex lo mantendrá bien informado de las tendencias del mercado! Al ser un cliente de InstaForex, se le proporciona una gran cantidad de servicios gratuitos para una operación eficiente.

