 Permanecer
Condiciones de negociación
Products
Herramientas


Europe's retail sales data were terrible, with growth slowing from 8.2% to 2.0% year on year. As for monthly terms, retail sales declined by 3.0% in December. As a result, the bad situation in the EU economy slowed down the rapidly growing value of the euro.
During the US trading session, the report of the United States Department of Labor was published, which confused traders. Here, the number of people employed in non-agricultural sectors of the economy increased by 467,000 against the forecasted growth of 210,000. The indicators are good, but the market was frightened by an increase in the unemployment rate to 4%.
As a result, the local growth of dollar positions was replaced by their sale on the market.
Analysis of trading charts from February 4:
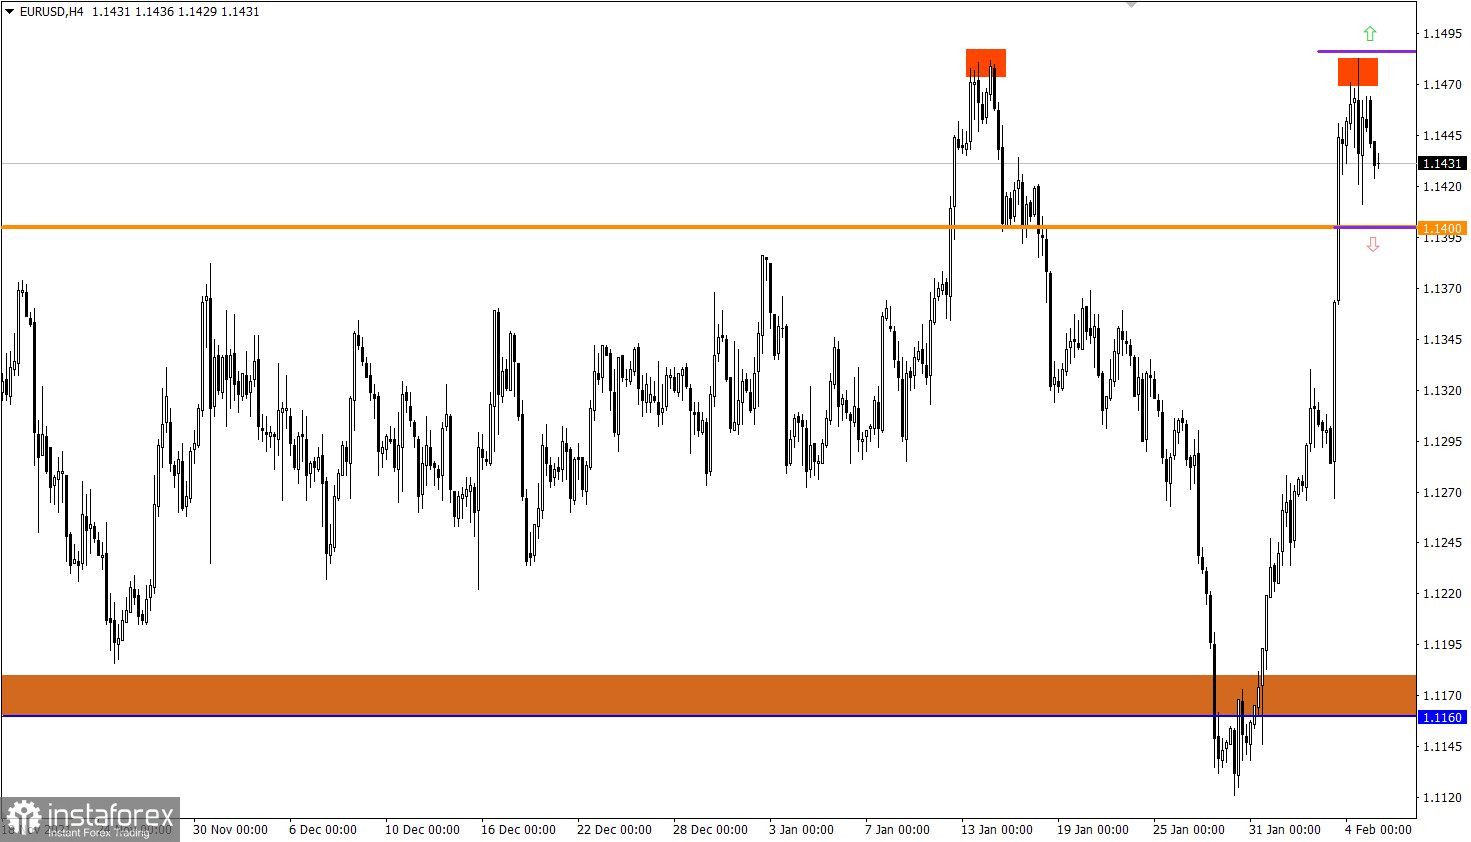
The EUR/USD pair reached the area of the local high on January 14 during a sharp growth, where there was a natural reduction in the volume of long positions. This led to a slowdown and, as a result, a temporary amplitude of 1.1410/1.1480.
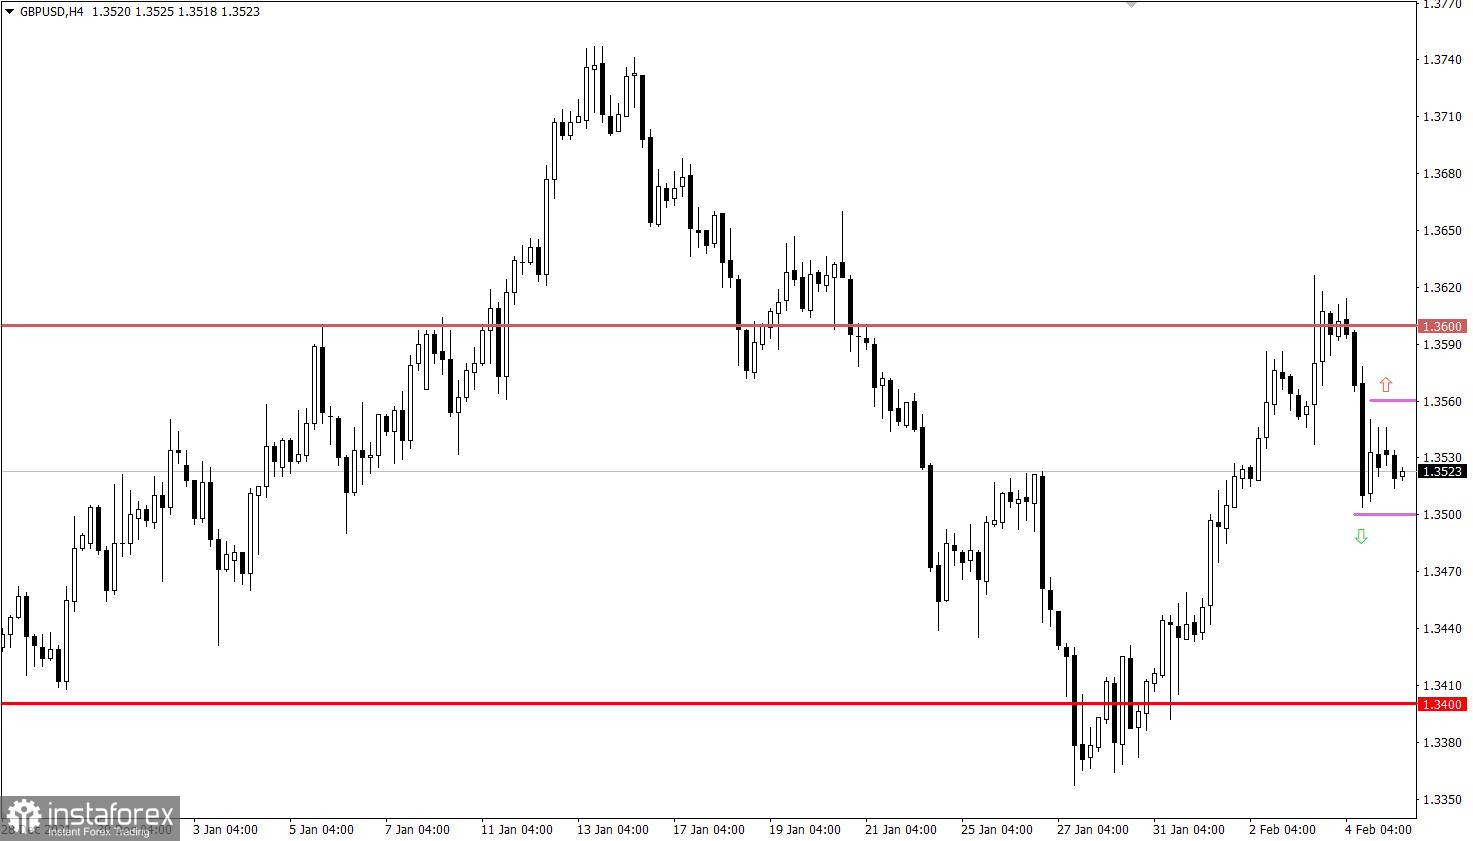
The GBP/USD pair reduced the volume of long positions after a short stagnation along the resistance level of 1.3600. This led to a reversal of about 100 points, which corresponds to the recent overbought status.
February 7 economic calendar:
Monday is traditionally accompanied by an empty macroeconomic calendar. Therefore, we should work out the data from last Friday, as well as closely monitor the information noise associated with the monetary policy of the United States and Europe.
Trading plan for EUR/USD on Feb 7:
In this situation, special attention is paid to the price stagnation of 1.1410/1.1480, since holding the price outside one or another border may indicate a subsequent price move.
We concretize the above-mentioned into trading signals:
Trading plan for GBP/USD on Feb 7:
The decline from the level of 1.3600 is still relevant in the market. To prolong it, it is necessary to keep the quote below the level of 1.3500. In this case, sellers will have a chance to further move towards 1.3450.
An alternative scenario of price development considers a slowdown relative to current values. This step may lead to the end of the downward cycle and the emergence of a buy signal if the price is kept above the level of 1.3561. In this situation, the quote will most likely return to the area of 1.3600.
What is reflected in the trading charts?
A candlestick chart view is graphical rectangles of white and black light, with sticks on top and bottom. When analyzing each candle in detail, you will see its characteristics of a relative period: the opening price, closing price, and maximum and minimum prices.
Horizontal levels are price coordinates, relative to which a stop or a price reversal may occur. These levels are called support and resistance in the market.
Circles and rectangles are highlighted examples where the price of the story unfolded. This color selection indicates horizontal lines that may put pressure on the quote in the future.
The up/down arrows are the reference points of the possible price direction in the future.
¡Los informes analíticos de InstaForex lo mantendrá bien informado de las tendencias del mercado! Al ser un cliente de InstaForex, se le proporciona una gran cantidad de servicios gratuitos para una operación eficiente.


