 Permanecer
Condiciones de negociación
Products
Herramientas


The European Union published the final data on inflation, which coincided with the preliminary estimate, which showed an acceleration in consumer price growth from 5.0% to 5.1%. This fact was already embedded in the prices, so it was ignored by the market. Now, the center of everyone's attention is the information flow.
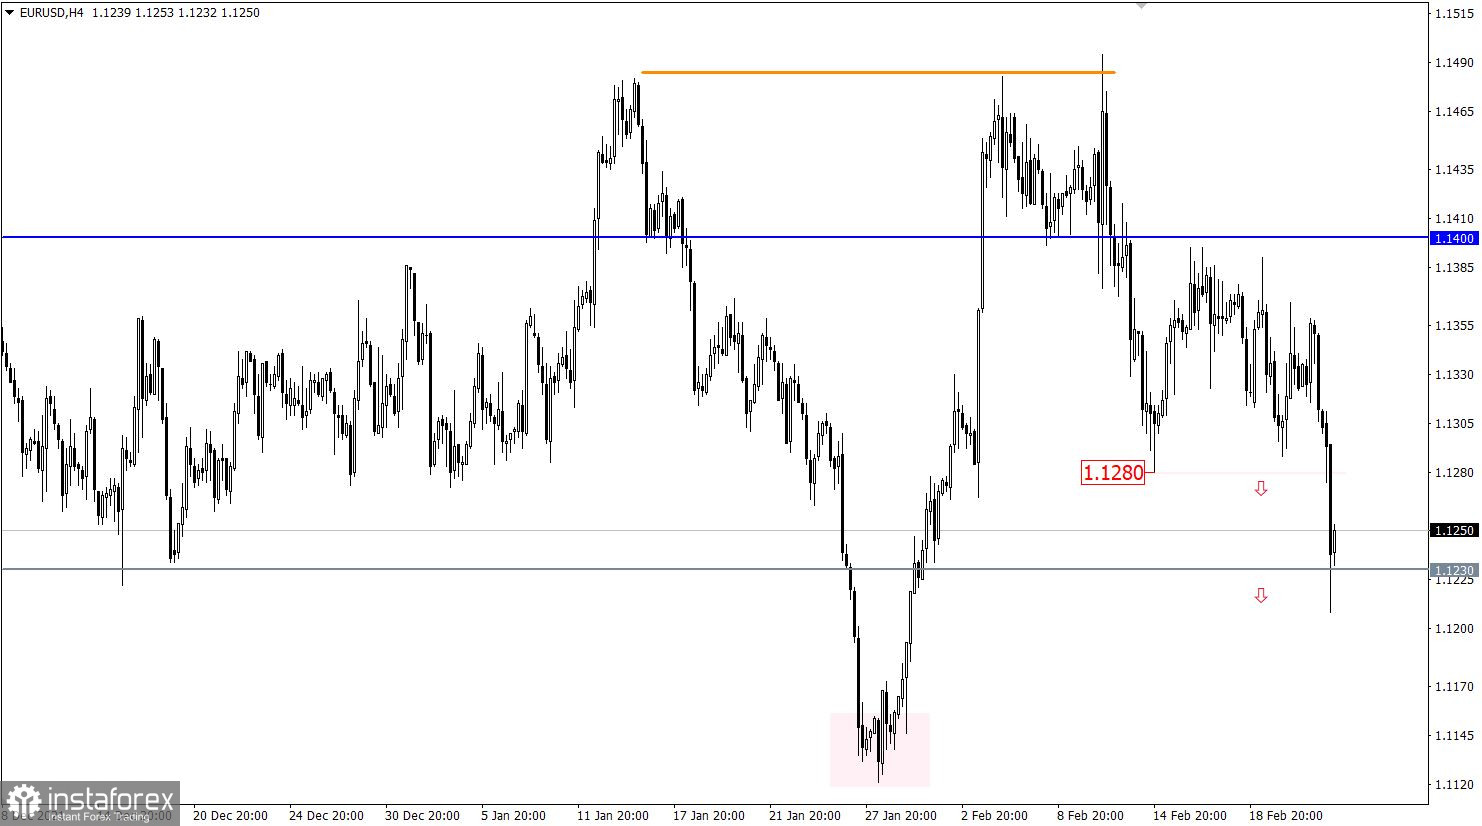
The EURUSD currency pair has accelerated its downward movement after the breakdown of the local minimum on February 14 - 1.1280. As a result, the market is witnessing a full-scale recovery of dollar positions relative to the correction in the period from January 31 to February 4.
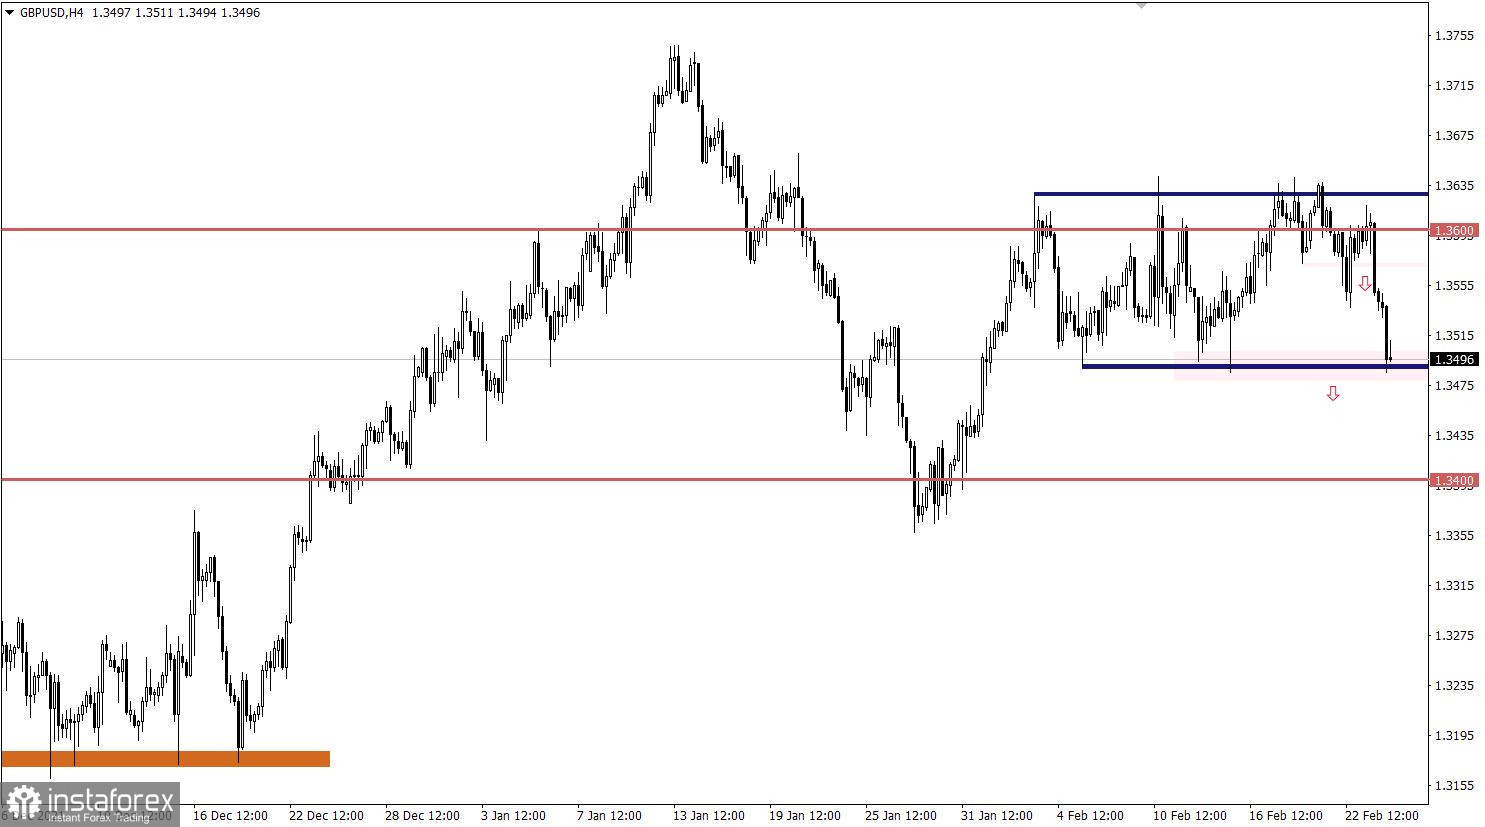
The GBPUSD currency pair rushed down on the wave of the general speculative mood. As a result, the quote touched the support area of 1.3485/1.3500, while not reducing the volume of short positions. This move indicates a change in trading interests from an upwards to a downward cycle.
The United States GDP data is expected to be published today, where, according to forecasts, the second estimate should coincide with the first, which is unlikely to affect the market in any way.
At the same time, weekly data on jobless claims in the U.S. will be published, which are expected to decrease in volume. This is a positive factor for the U.S. labor market if expectations match.
Statistics details:
The volume of initial claims for unemployment benefits may be reduced from 248,000 to 235,000.
The volume of continuing claims for benefits may be reduced from 1.593M to 1.580M.
Time targeting
U.S. GDP - 13:30 Universal time
U.S. Jobless Claims - 09:30 Universal time
Information and news noise
The flow of information is developing so rapidly that it leads to a wave of speculation in the market. Therefore, the topic of Ukraine leads to sharp price changes in the entire financial sector, whether it is the currency or stock market. It is worth keeping track of the news flow and getting ready for new bursts of activity from speculators.
In this situation, traders are considering the subsequent recovery of the dollar, where the local low of the downward trend at 1.1121 is used as a guideline. As a variable point of support on the way of sellers, there is coordinate 1.1230, which can locally contain the ardor of speculators. Thus, the subsequent increase in the volume of short positions should be expected after the stable holding of the price below 1.1230 in a four-hour period.
In this situation, a stable holding of the price below 1.3485 will lead to further strengthening of the U.S. dollar. Traders are considering a possible price movement towards the local minimum on January 27 at 1.3357.
An alternative scenario will arise in case of a reduction in the volume of short positions in the support area of 1.3485/1.3500. This will lead to a slowdown in the downward move and, as a result, to a price rebound.
A candlestick chart view is graphical rectangles of white and black light, with sticks on top and bottom. When analyzing each candle in detail, you will see its characteristics of a relative period: the opening price, closing price, and maximum and minimum prices.
Horizontal levels are price coordinates, relative to which a stop or a price reversal may occur. These levels are called support and resistance in the market.
Circles and rectangles are highlighted examples where the price of the story unfolded. This color selection indicates horizontal lines that may put pressure on the quote in the future.
The up/down arrows are the reference points of the possible price direction in the future.
¡Los informes analíticos de InstaForex lo mantendrá bien informado de las tendencias del mercado! Al ser un cliente de InstaForex, se le proporciona una gran cantidad de servicios gratuitos para una operación eficiente.


