 Permanecer
Condiciones de negociación
Products
Herramientas


Data on the lending market in Britain coincided with the expectations of experts. Mortgage lending is rapidly declining, as is the number of approved mortgages. Against this negative background, no one paid attention to the growth in consumer lending.
During the American trading session, data on the number of job vacancies in the United States was published, which slightly decreased in volume.
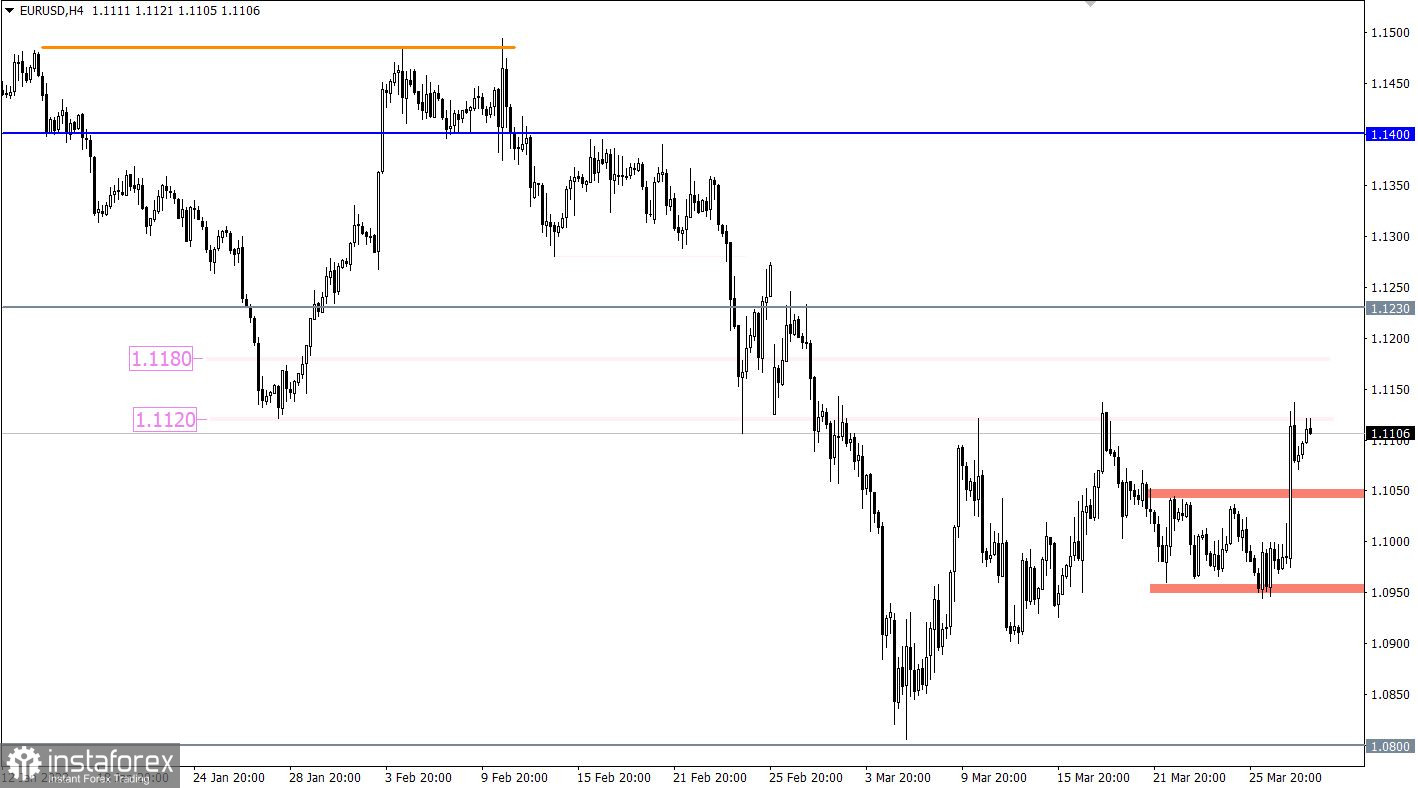
The EURUSD currency pair showed strong upward interest after a long stagnation in the 1.0960/1.1050 range. As a result of the short exchange rate, the euro strengthened by more than 150 points, eventually hitting a local maximum on March 17 at 1.1137.
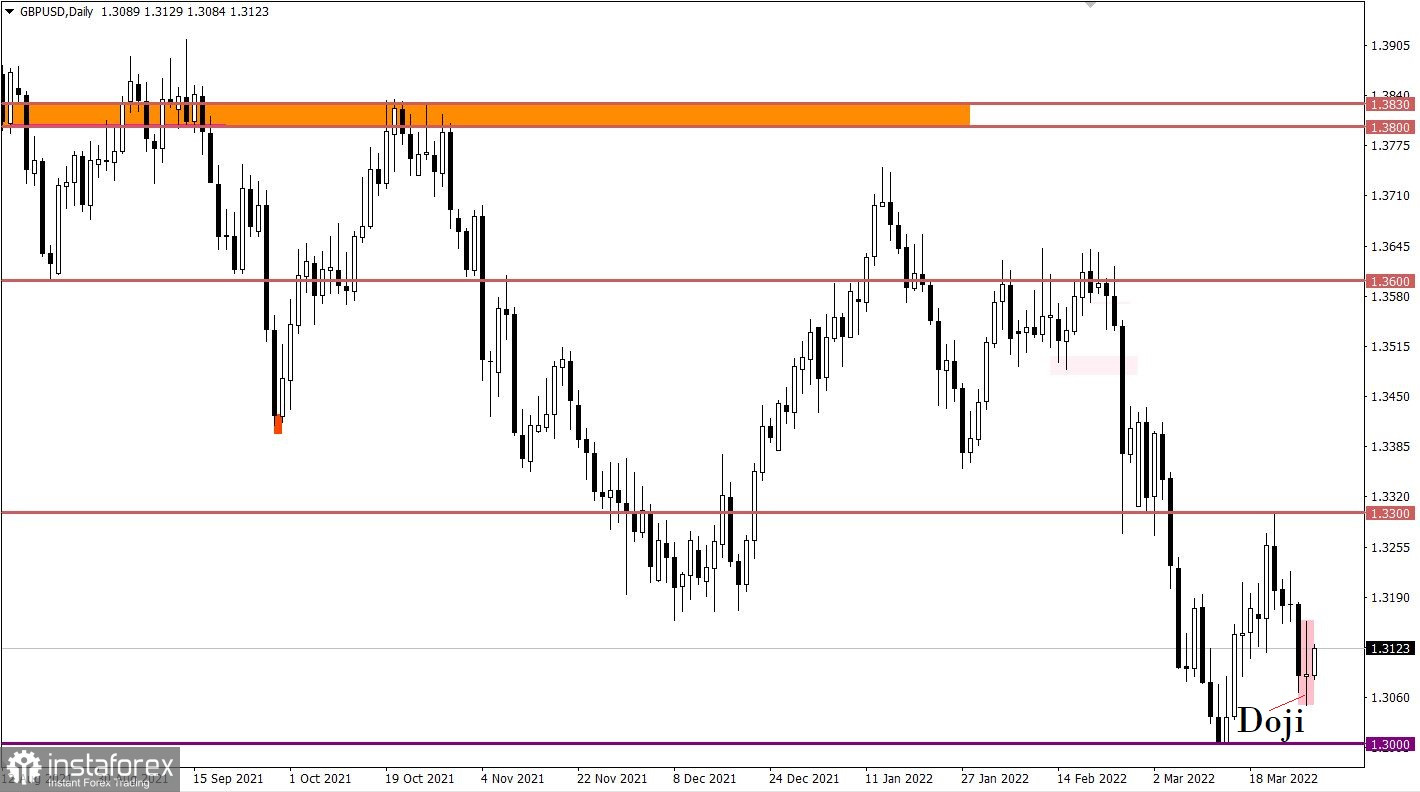
Despite the high speculative activity, the GBPUSD pair ended the day near the opening, which led to the formation of a Doji candlestick pattern. This candlestick signals the balance of trading forces as well as uncertainty among traders.

Today, the ADP report on employment in the United States is expected to be published, which is projected to grow by 450,000 in March. This is a positive signal for the labor market if the data is confirmed.
Almost simultaneously with the ADP report, the final data on the United States GDP for 2021 will be published. The data will likely be left without much attention, which will confirm the preliminary assessment.
Time targeting
ADP report - 12:15 Universal time
U.S. GDP - 12:30 Universal time
In this situation, the local maximum at 1.1137 plays the role of resistance, which temporarily put pressure on buyers in the form of a technical pullback. In order for the upward cycle to be extended to new price levels, the quote needs to stay above 1.1180 in a four-hour period. This step will lead to further formation of a corrective move from the pivot point 1.0800. At the same time, the regular basis of the past, associated with the 1.1120/1.1180 area, may well put pressure on long positions. In this case, a slowdown in the upward cycle is possible, followed by a weakening of the euro, following the example of a price rebound on March 17th.
In this situation, a characteristic uncertainty could arise due to the convergence of the price with the psychologically important level of 1.3000, where there was a reduction in the volume of short positions in history. The risk of a price rebound from the pivot point in the market remains, so the prolongation of the downward cycle will be considered by traders only after holding the quote below 1.3000 in a four-hour period. Until then, a variable or a local pullback is possible.
A candlestick chart view is graphical rectangles of white and black light, with sticks on top and bottom. When analyzing each candle in detail, you will see its characteristics of a relative period: the opening price, closing price, and maximum and minimum prices.
Horizontal levels are price coordinates, relative to which a stop or a price reversal may occur. These levels are called support and resistance in the market.
Circles and rectangles are highlighted examples where the price of the story unfolded. This color selection indicates horizontal lines that may put pressure on the quote in the future.
The up/down arrows are the reference points of the possible price direction in the future.
¡Los informes analíticos de InstaForex lo mantendrá bien informado de las tendencias del mercado! Al ser un cliente de InstaForex, se le proporciona una gran cantidad de servicios gratuitos para una operación eficiente.

