 Permanecer
Condiciones de negociación
Products
Herramientas


Data on industrial production in the UK reflected a slowdown in growth from 3.0% to 1.6%, and these are only figures for February. Consequently, the situation will only worsen, where according to the results of the March data, a decline in industrial production will be recorded.
The reaction of the pound sterling to the current indicators was negative.
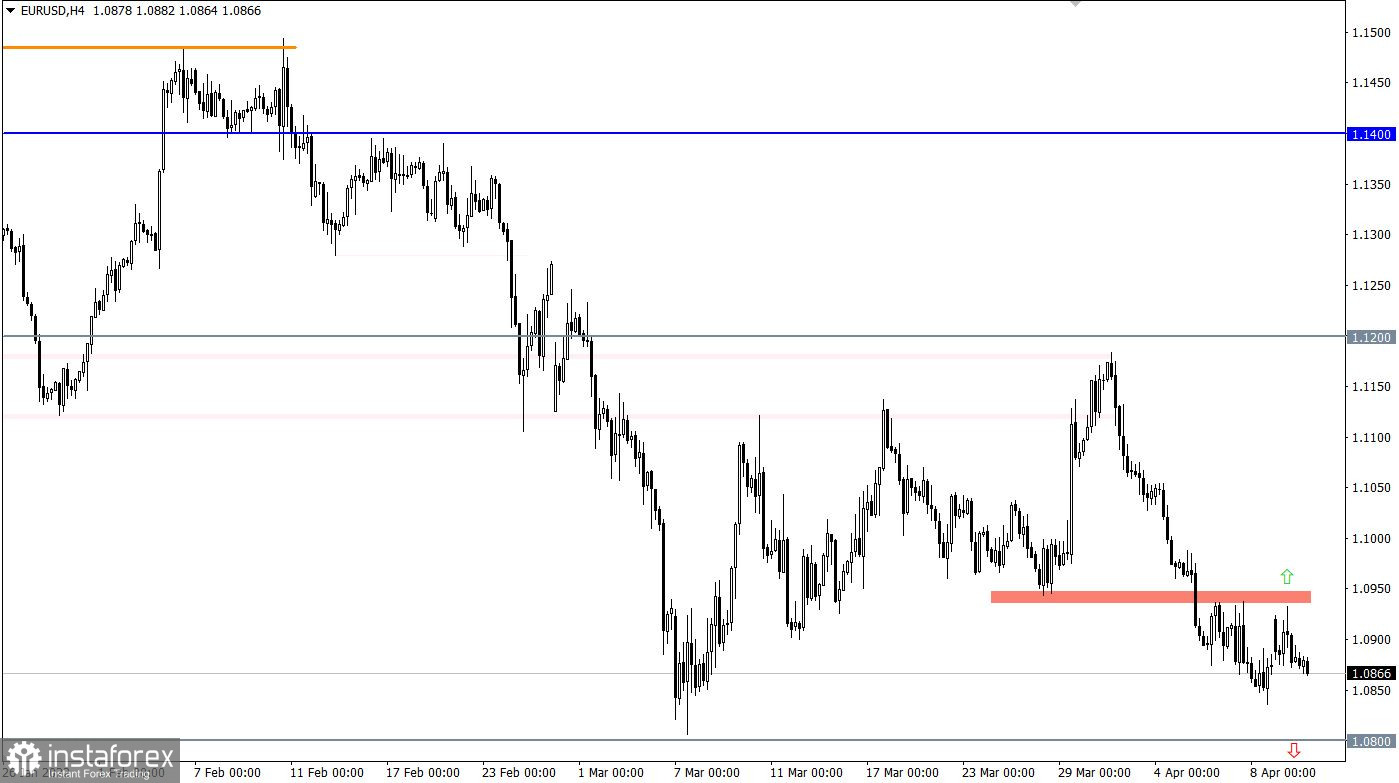
The EURUSD currency pair slowed down its downward course, which led to a pullback from the 1.0800/1.0835 support area, and then to a price stagnation. Despite the local reduction in the volume of short positions, the downward interest remains in the market. This is indicated by the almost complete recovery of the price relative to the recent corrective move.
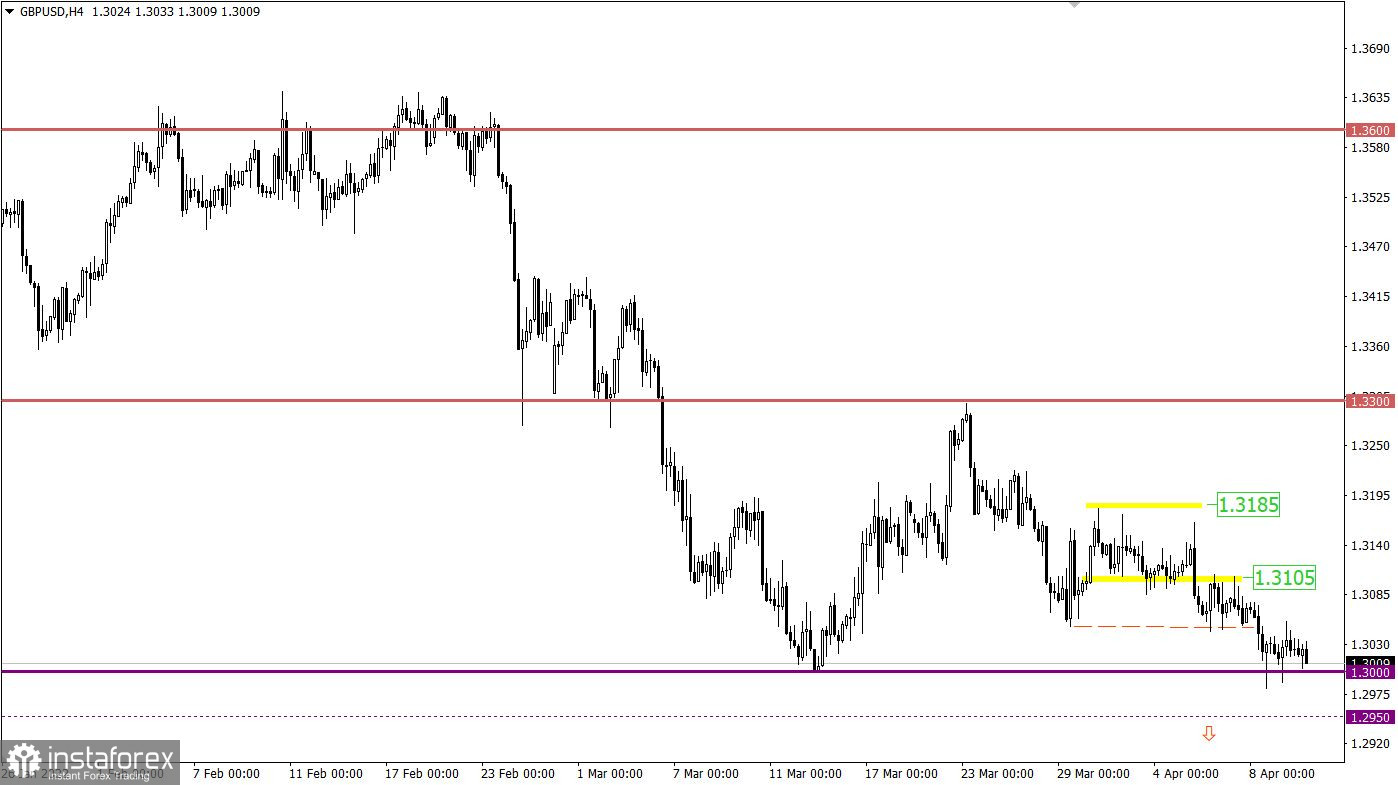
The GBPUSD currency pair reduced the volume of short positions after touching the 1.3000 level. This led to a sharp slowdown in the downward course, as a result of the formation of stagnation within the deviation of the psychological level.

Data on the UK labor market published earlier today showed that the unemployment rate fell from 3.9% to 3.8%. At the same time, employment in the country increased by 10,000 during February, and the number of claims for unemployment benefits decreased by 46,900.
The figures for Britain are by no means bad, but there was no market reaction at the time of publication.
During the American trading session, data on inflation in the United States will be published, where consumer price growth is expected to rise from 7.9% to 8.5%. Such high inflation damages the economy, thus it is a negative factor for the US dollar.
Time targeting
US inflation - 12:30 UTC
The signal about the prolongation of the medium-term downward trend will come from the market at the moment the price holds below the level of 1.0800 for at least a four-hour period. Until then, fluctuations are possible, where the value of 1.0935 serves as a variable resistance. The signal about the transition from the initial pullback to the correction stage from the support area will be considered by traders if the price holds above 1.0940 in a four-hour period. This move could push the quote towards the psychological level of 1.1000.
In this situation, the price stagnation of 1.3000/1.3050 serves as an accumulation of trading forces, where traders consider two possible scenarios at once. The first scenario is based on the method of rebounding the price from an important level, where holding the quote above 1.3055 may indicate local interest in buying the pound sterling. The second scenario considers the prolongation of the medium-term trend, where at the beginning there may be an acceleration of the price towards the lower deviation of the psychological level, this is the value of 1.2950. After holding the price below 1.2950 in a four-hour period, there will be a signal about the prolongation of the downward trend.
A candlestick chart view is graphical rectangles of white and black light, with sticks on top and bottom. When analyzing each candle in detail, you will see its characteristics of a relative period: the opening price, closing price, and maximum and minimum prices.
Horizontal levels are price coordinates, relative to which a stop or a price reversal may occur. These levels are called support and resistance in the market.
Circles and rectangles are highlighted examples where the price of the story unfolded. This color selection indicates horizontal lines that may put pressure on the quote in the future.
The up/down arrows are the reference points of the possible price direction in the future.
¡Los informes analíticos de InstaForex lo mantendrá bien informado de las tendencias del mercado! Al ser un cliente de InstaForex, se le proporciona una gran cantidad de servicios gratuitos para una operación eficiente.


