 Permanecer
Condiciones de negociación
Products
Herramientas


Two world central banks – the ECB and the BoE – held monetary policy meetings yesterday. Both raised interest rates by 50 basis points, in line with market expectations.
The ECB Governing Council decided to lift the three key ECB interest rates by 50 basis points. This takes the main lending rate to 2.5%, the deposit rate to 2%, and the margin lending facility rate to 2.75%.
"The Governing Council today decided to raise the three key ECB interest rates by 50 basis points and, based on the substantial upward revision to the inflation outlook, expects to raise them further," the ECB minutes said.
The regulator also stressed the need for further rate hikes to ensure a timely return of inflation to the 2% target.
The BoE in turn increased the interest rate to 3.5%, marking its ninth straight rise. Thus, the interest rate is now at its highest level in 14 years.
According to the BoE, the UK is now going through a recession although the economy is in better health than projected in November. The regulator expects UK GDP to fall by 0.1% in the fourth quarter, following a 0.5% drop in the third quarter.
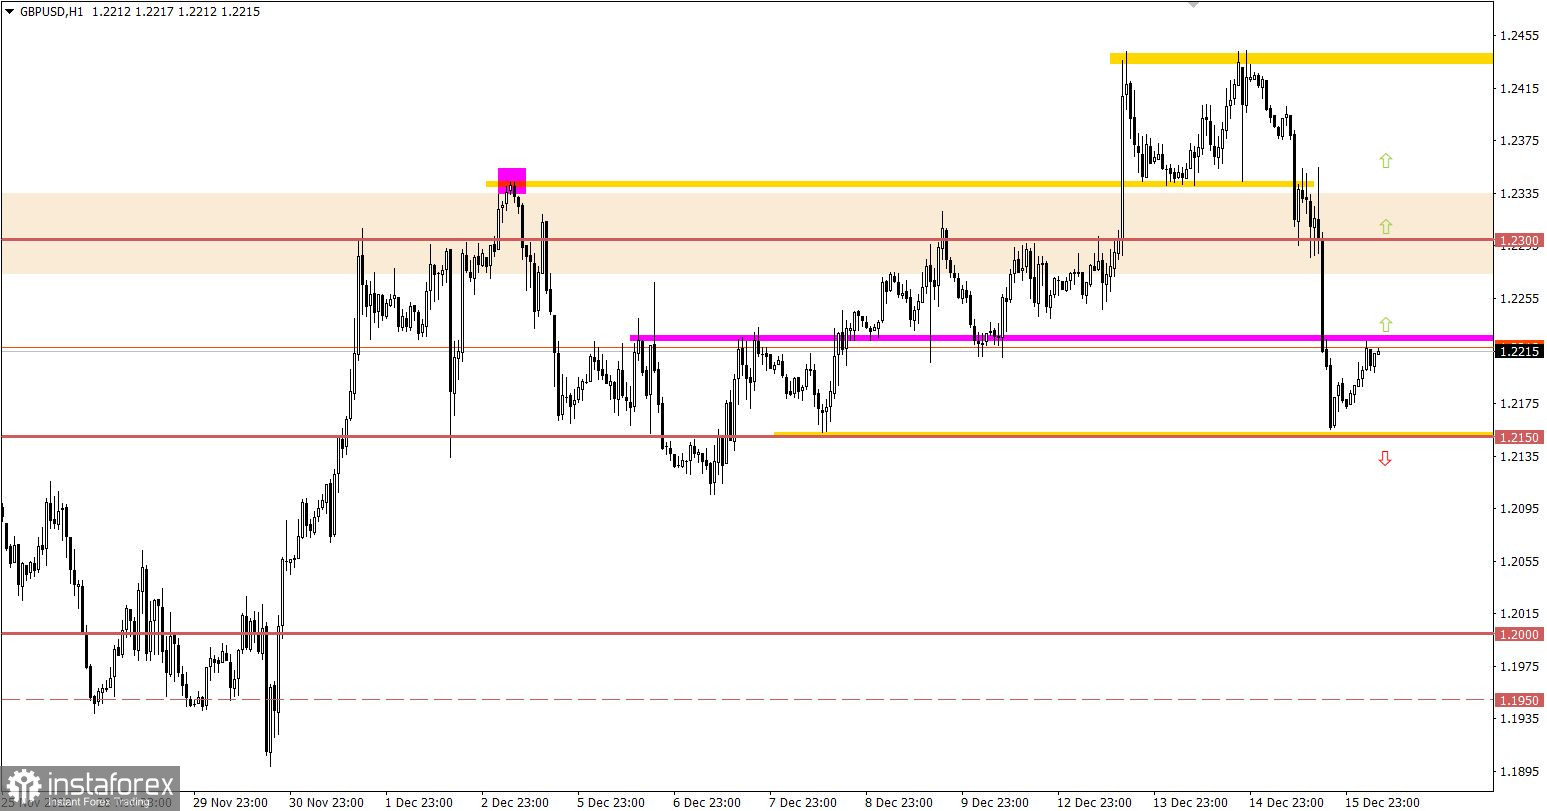
It seems that the Board's voting became the main reason behind the fall in the sterling.
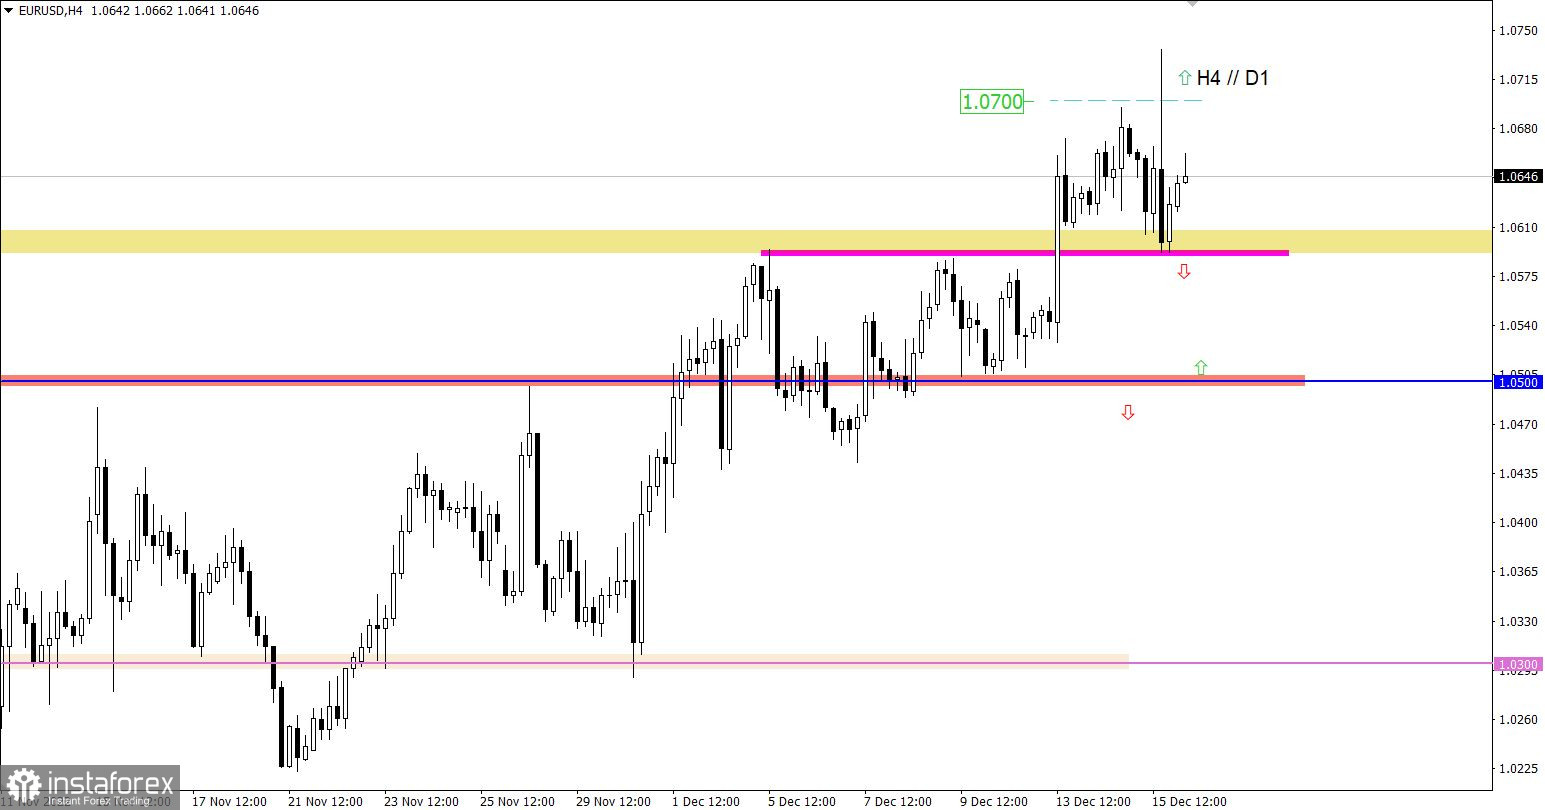
EUR/USD briefly went above 1.0700 and then quickly dropped below the level. Thus, the pair is now flat at the peak of the uptrend.
GBP/USD was bearish and plunged by 150 pips. The quote eventually reached and tested the support level of 1.2150.
With the opening of European trade, the UK delivered its retail sales data. A slump in retail sales slowed to -5.9% versus -6.1%.
The eurozone will see the release of its inflation statistics. If figures come in line with preliminary estimates, no reaction from the market will follow. Otherwise, speculative activity may increase.
Speculators will pay special attention to preliminary business activity data in the UK, the eurozone, and the US.
The uptrend may continue if the price settles above 1.0700 in the 4-hour time frame at least. The target is seen at 1.0800.
Alternative scenario: if the quote fails to consolidate above 1.0700, a correction may occur.
It may be assumed that the pair is now recovering, following its recent plunge. A buy signal may be generated once the price settles above 1.2230 in the 4-hour time frame.
Alternatively, should the quote consolidate below 1.2150 in the 4-hour time frame, a correction may follow.
The candlestick chart shows graphical white and black rectangles with upward and downward lines. While conducting a detailed analysis of each individual candlestick, it is possible to notice its features intrinsic to a particular time frame: the opening price, the closing price, and the highest and lowest price.
Horizontal levels are price levels, in relation to which a stop or reversal of the price may occur. They are called support and resistance levels.
Circles and rectangles are highlighted examples where the price reversed in the course of its history. This color highlighting indicates horizontal lines which can exert pressure on prices in the future.
Upward/downward arrows signal a possible future price direction.
¡Los informes analíticos de InstaForex lo mantendrá bien informado de las tendencias del mercado! Al ser un cliente de InstaForex, se le proporciona una gran cantidad de servicios gratuitos para una operación eficiente.

