 Permanecer
Condiciones de negociación
Products
Herramientas


The United States Department of Labor released its December jobs report, which caused a backlash in the markets.
Report details:
- Unemployment fell from 3.6% to 3.5%, with market expectations of 3.7%.
- Nonfarm payrolls rose by 220,000, while market expectations were 180,000. We have a reading above November.
- Average hourly wages fell to 4.6% (y/y) in December from a 4.8% (y/y) a month earlier.
At first glance, the statistics are very good, but in the current state of affairs, these figures may indicate an overheating of the labor market. In this case, the opposite effect may occur in the form of a sharp increase in the unemployment rate.
The U.S. dollar reacted to the statistics with a sharp weakening of competitors in the market.

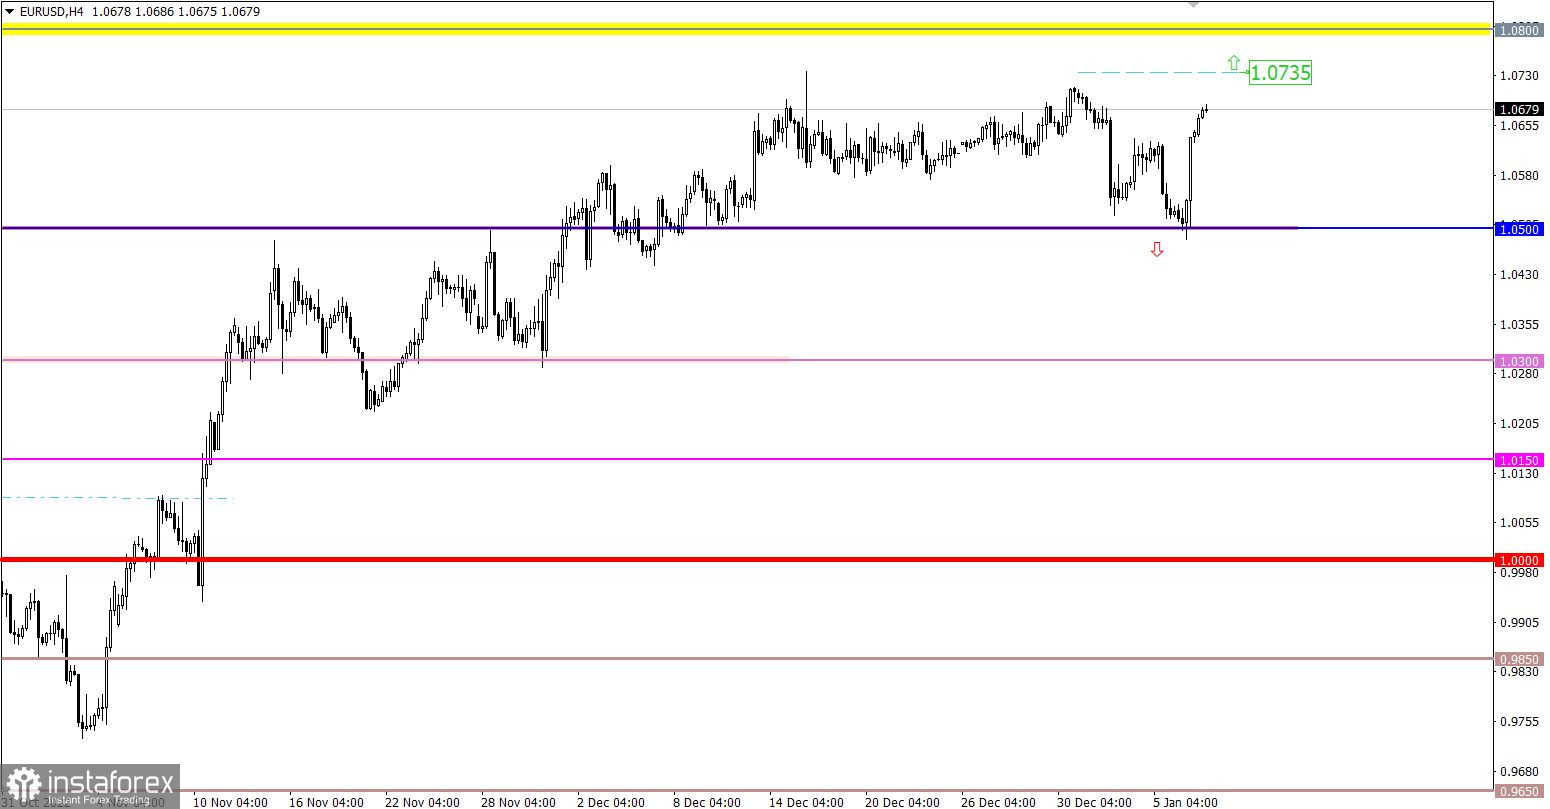
The EURUSD currency pair changed direction last Friday from a downward to an upward cycle. The 1.0500 support level served as a support, relative to which an inertial upward movement appeared. As a result, the euro exchange rate has strengthened by more than 150 points.
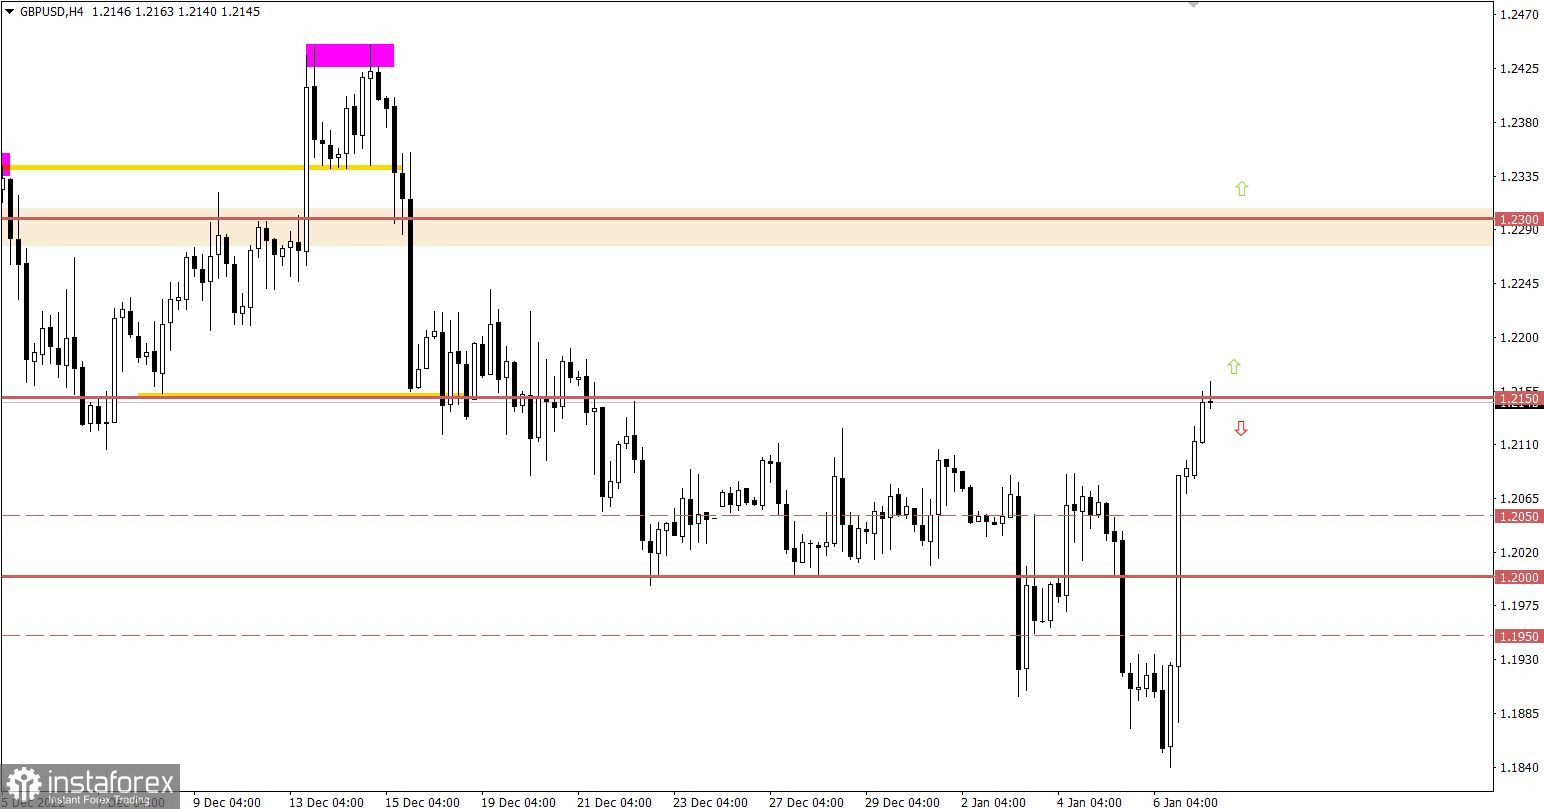
The GBP/USD currency pair gained more than 250 points last Friday, which won back lost positions since the beginning of the month, and the quote went above 1.2100. It is worth noting that we have a sell-off of dollar positions throughout the Forex market.
What is definitely worth paying attention to today is the statistics on unemployment in the EU, but based on forecasts, its level may remain at 6.5%.
Time targeting
EU unemployment rate – 10:00 UTC
In this situation, the inertial move still takes place on the market, but in order to strengthen long positions on the euro, the quote needs to stay above 1.0735. In this scenario, there will be a technical signal about the prolongation of the upward trend from October last year.
Failure to properly hold the price above the benchmark allows for a rebound scenario, which is acceptable given the euro's increasing overbought status in the short term.
In this situation, the inertial upward movement can be maintained in the market due to the speculative mood of traders. The subsequent increase in the volume of long positions is expected after holding the price above the level of 1.2150 in a four-hour period.
It is worth noting that such rapid price changes often lead to overheating of trading positions. For this reason, the occurrence of a technical pullback should not be ruled out.
The candlestick chart type is white and black graphic rectangles with lines above and below. With a detailed analysis of each individual candle, you can see its characteristics relative to a particular time frame: opening price, closing price, intraday high and low.
Horizontal levels are price coordinates, relative to which a price may stop or reverse its trajectory. In the market, these levels are called support and resistance.
Circles and rectangles are highlighted examples where the price reversed in history. This color highlighting indicates horizontal lines that may put pressure on the asset's price in the future.
The up/down arrows are landmarks of the possible price direction in the future.
¡Los informes analíticos de InstaForex lo mantendrá bien informado de las tendencias del mercado! Al ser un cliente de InstaForex, se le proporciona una gran cantidad de servicios gratuitos para una operación eficiente.


