 Permanecer
Condiciones de negociación
Products
Herramientas


Last week ended with the publication of data on industrial production in the United Kingdom and the European Union. The rate of decline in UK industrial production accelerated from -4.7% to -5.1%. These are poor figures, which signal a confident slide of the British economy into recession. Moreover, previous figures were revised for the worse. A month earlier, similar data showed a decline in the industry of -2.4%.
In the European Union, things were better, with industrial production showing growth of 2.0%. However, in the previous month, the growth rate was 3.4%. Thus, there is a slowdown in the growth rate.
There was no proper reaction to the statistical data in the market.
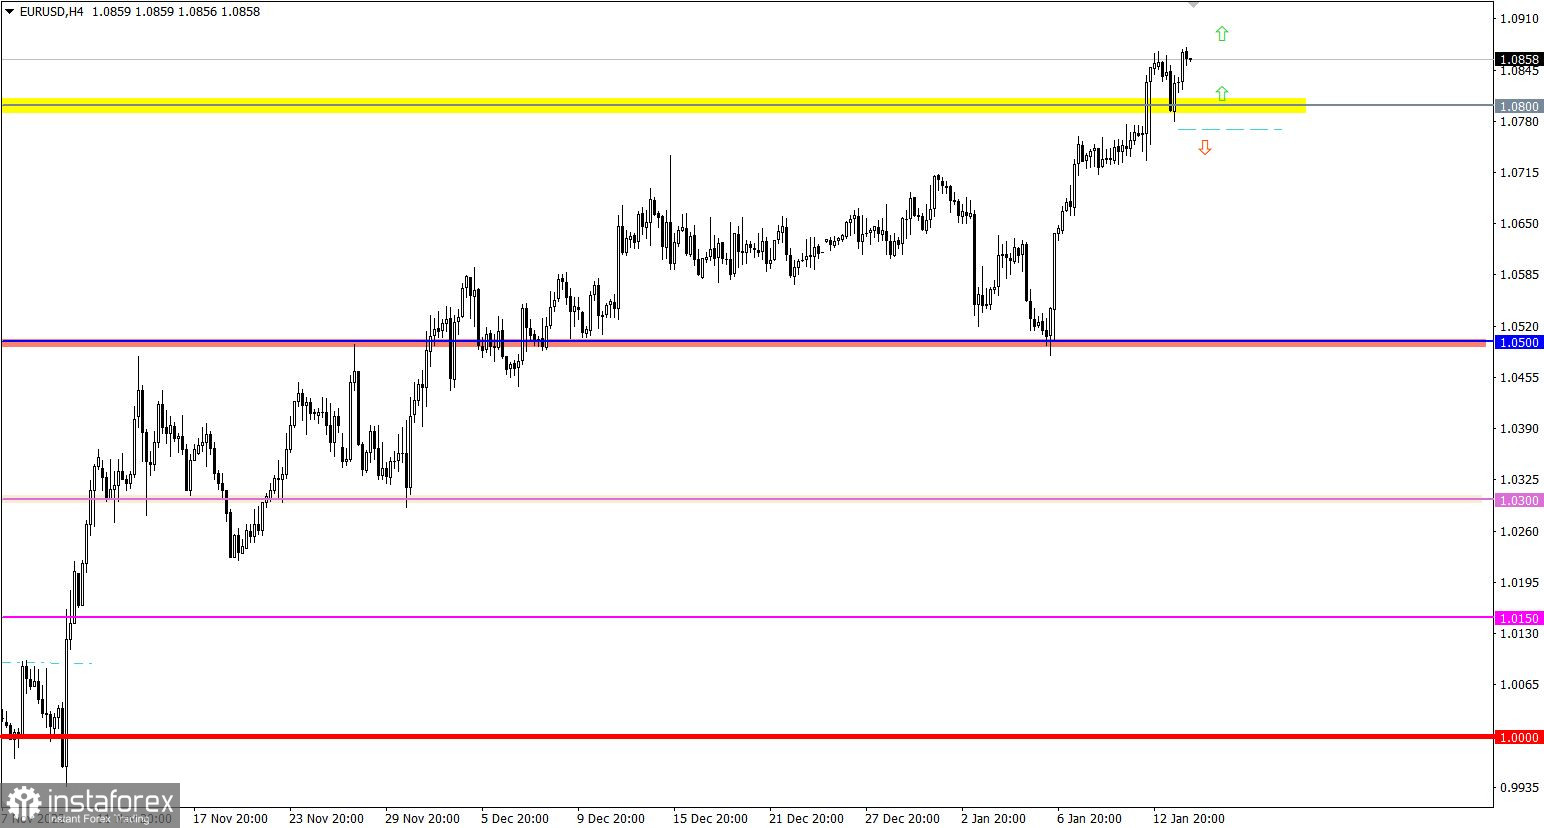
EURUSD strengthened in value by more than 200 points at the peak of the cycle during the past week. As a result, the quote updated the local high and held above the 1.0800 resistance level. The absence of a full-blown correction in the market, despite the fact that the overbought status was observed at the peak of the cycle, suggests that speculators ignore the overheating of long positions in the euro.
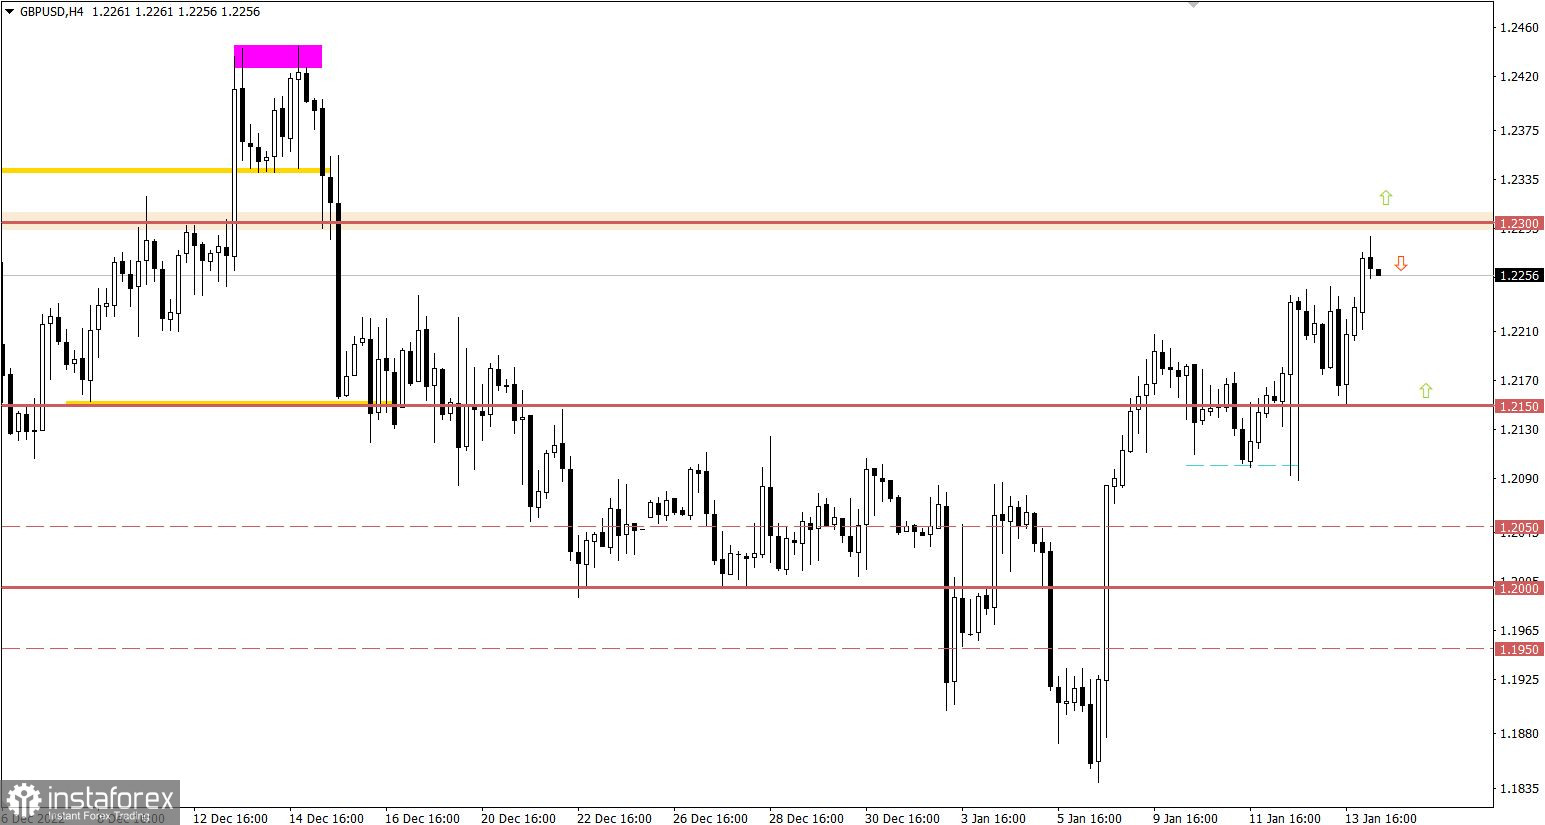
GBPUSD appreciated by about 150 points during the past week. Unlike the euro, the pound has not yet updated the local high of the upward trend of October last year. At the moment, there is a recovery relative to the corrective move from the mid-December.
Today, the macroeconomic calendar is empty, the publication of important statistics is not expected. It is worth noting that today is Martin Luther King Day in the United States. For this reason, banks and stock exchanges are not working.
The previously passed 1.0800 resistance level is now playing the role of support, where the price rebounded during the recent pullback. This again indicates the desire of buyers to keep the upward cycle set in the market. A stable holding of the price above the 1.0800 level allows the subsequent growth of the euro.
As for the consideration of downside scenario, the quote first needs to return below the value of 1.0770 in a four-hour period.
In order to strengthen long positions on the pound sterling, the quote needs to stay above the 1.2300 level for at least a four-hour period. Otherwise, the scenario of a price rebound in the direction of 1.2150 is possible.
The candlestick chart type is white and black graphic rectangles with lines above and below. With a detailed analysis of each individual candle, you can see its characteristics relative to a particular time frame: opening price, closing price, intraday high and low.
Horizontal levels are price coordinates, relative to which a price may stop or reverse its trajectory. In the market, these levels are called support and resistance.
Circles and rectangles are highlighted examples where the price reversed in history. This color highlighting indicates horizontal lines that may put pressure on the asset's price in the future.
The up/down arrows are landmarks of the possible price direction in the future.
¡Los informes analíticos de InstaForex lo mantendrá bien informado de las tendencias del mercado! Al ser un cliente de InstaForex, se le proporciona una gran cantidad de servicios gratuitos para una operación eficiente.


