 Permanecer
Condiciones de negociación
Products
Herramientas


The trading day yesterday was jam-packed with important news. In the early European session, the UK reported on its inflation for December. The CPI eased its annual growth to 10.5% from 10.7%. Despite the signs of easing inflationary pressure, headline inflation remains at elevated levels. However, a slowdown in annual CPIs assures the Bank of England to revise the ongoing monetary tightening. It means that the central bank will either moderate the pace of rate hikes or will put interest rates on hold.
Besides, the EU unveiled its revised inflation data which coincided in full with flash estimates. The CPI in the 10 countries of the euro area slipped to 9.2% in December from 10.1% in November on year. Despite the lukewarm market response, there is fresh evidence of declining inflation rates. Therefore, the ECB might soften its rhetoric on monetary tightening, in particular, it could fine-tune its agenda for rate hikes.
During the New York trade, the economic calendar was also loaded with statistics. Market participants got to know US retail sales which contracted to 6.02% from 6.50% on year in November. Notably, the previous reading for October was downgraded from 6.50% to 6.01%. Thus, retail sales remained roughly flat in annual terms. The US industrial production shrank to 1.65% from 2.18%.
Despite tepid metrics from the US, retail sales actually remained the same. Perhaps this news supported the US dollar.

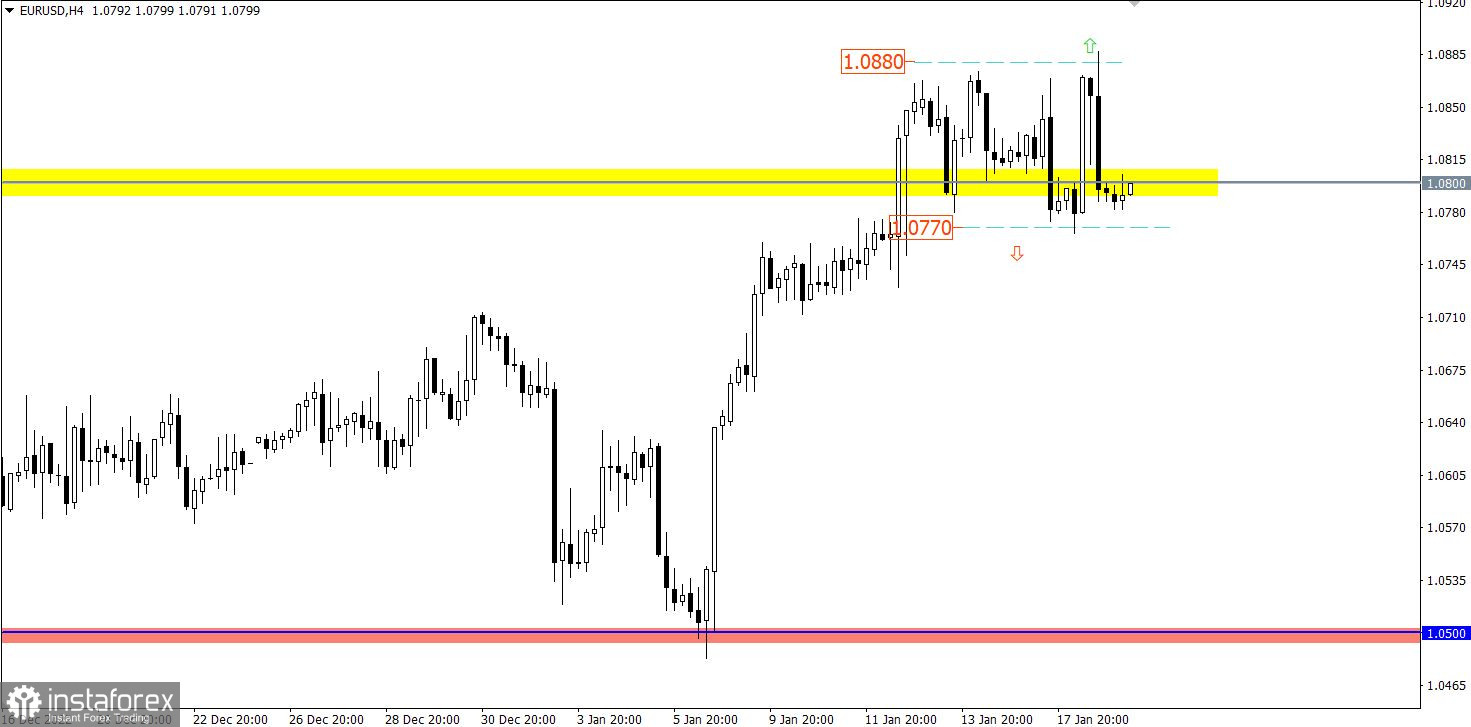
Despite fluctuations, EUR/USD is still trading sideways at the peak of the upward cycle. The borders are defined between 1.0800 and 1.0870, though the price slightly deviates from these levels.
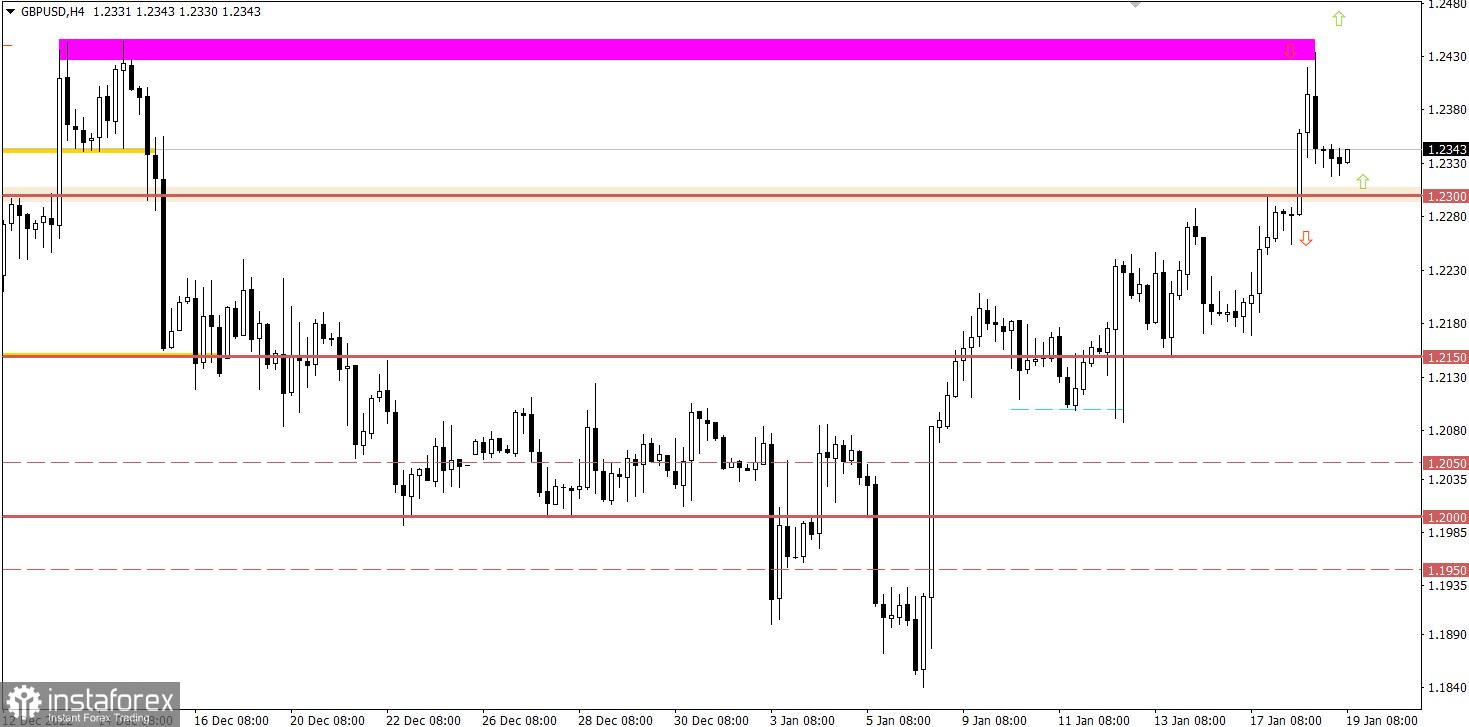
Following upward momentum, GBP/USD passed through resistance at 1.2300. As a result, the bullish cycle gained impetus. So, the pound sterling managed to approach tightly the high of December. The next move was a downward retracement that made traders cut on long positions.
Economic calendar on January 19
Today the economic calendar contains a weekly update on unemployment claims which are expected to rise last week. This is a negative factor for the US labor market, though a decline in claims is insignificant.
Details of economic reports
Continuing unemployment claims might have increased from 1.351 mln to 1.370 mln
Initial unemployment claims might have increased from 205K to 214K
Schedule
US unemployment claims report is due at 13:30 GMT
The price is oscillating within the trading range which means the accumulation of a particular momentum. Eventually, the price will escape from one of the borders.
For the upside scenario, the instrument has to settle above 1.0880 on the 4-hour chart. This move will extend the ongoing upward cycle.
The downside scenario will come into play as a correctional move inside the overall upward cycle. Traders will have an excuse to increase short positions if the price settles below 1.0770 on the 4-hour chart.
At the retracement stage, GBP/USD retreated to 1.2300 which means a minor price change amid the ongoing sterling's advance. To turn a retracement into a full-fledged correction, the instrument has to return to levels below 1.2250 on the 4-hour chart. In this case, the currency pair could move down to 1.2150.
Nevertheless, if the price settles above 1.2300, traders will find an excuse to enter the market with long positions. Hence, the pair could update a local high of the upward cycle.
The candlestick chart type is white and black graphic rectangles with lines above and below. With a detailed analysis of each individual candle, you can see its characteristics relative to a particular time frame: the opening price, closing price, intraday high and low.
Horizontal levels are price coordinates, relative to which a price may stop or reverse its trajectory. In the market, these levels are called support and resistance.
Circles and rectangles are highlighted examples where the price reversed in history. This color highlighting indicates horizontal lines that may put pressure on the asset's price in the future.
¡Los informes analíticos de InstaForex lo mantendrá bien informado de las tendencias del mercado! Al ser un cliente de InstaForex, se le proporciona una gran cantidad de servicios gratuitos para una operación eficiente.


