 Permanecer
Condiciones de negociación
Products
Herramientas


UK GDP slowed to 0.4% from 1.9% in the fourth quarter although came slightly better than expected.
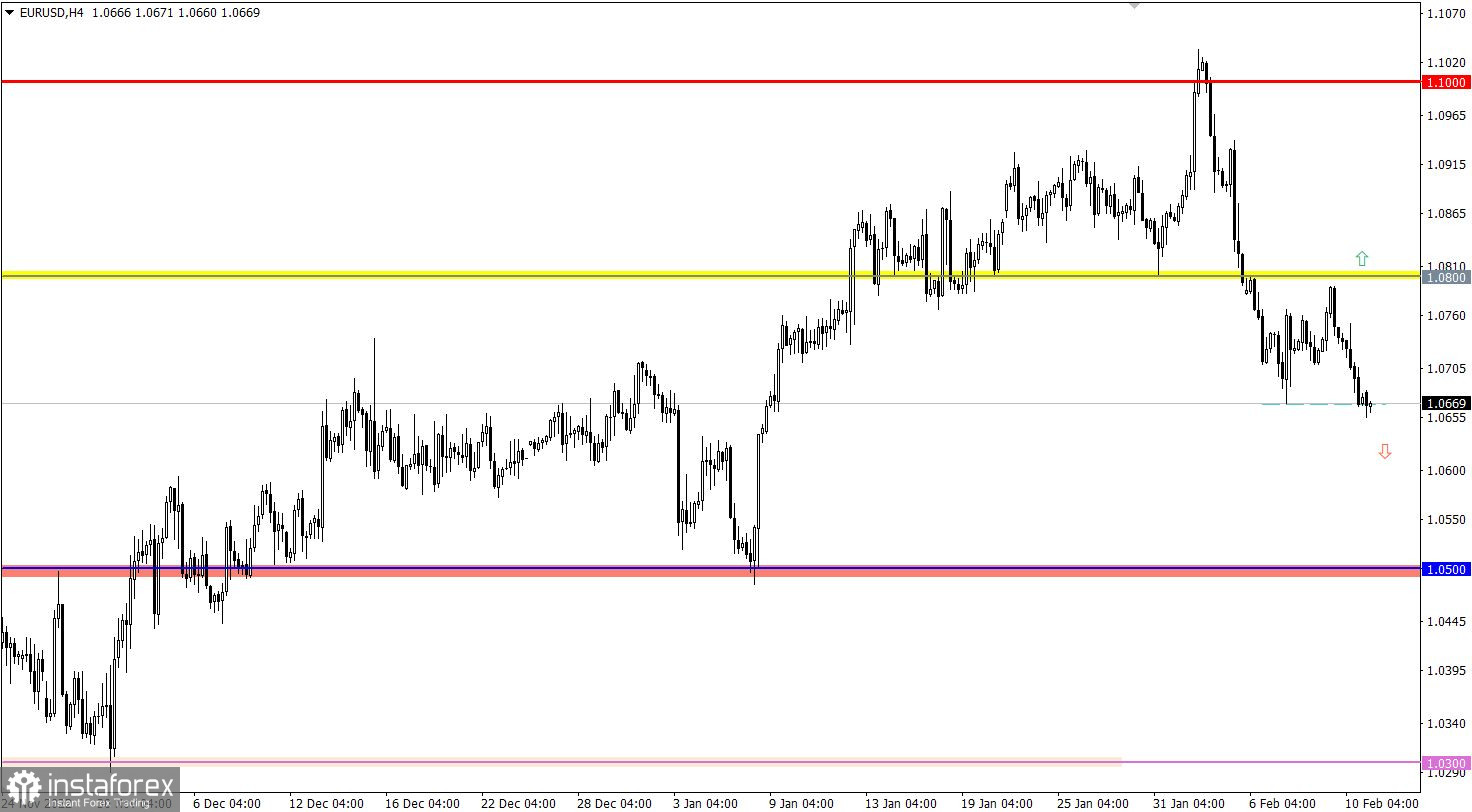
On Friday, ECB member Isabel Schnabel responded to journalists' questions. She was asked over 30 questions in total and gave vague answers to questions about interest rates. Clearly, the euro showed weakness because the market expected clearer remarks from the ECB official.
Moving down, EUR/USD hit a new low, and the corrective move went on from the high of the medium-term trend.
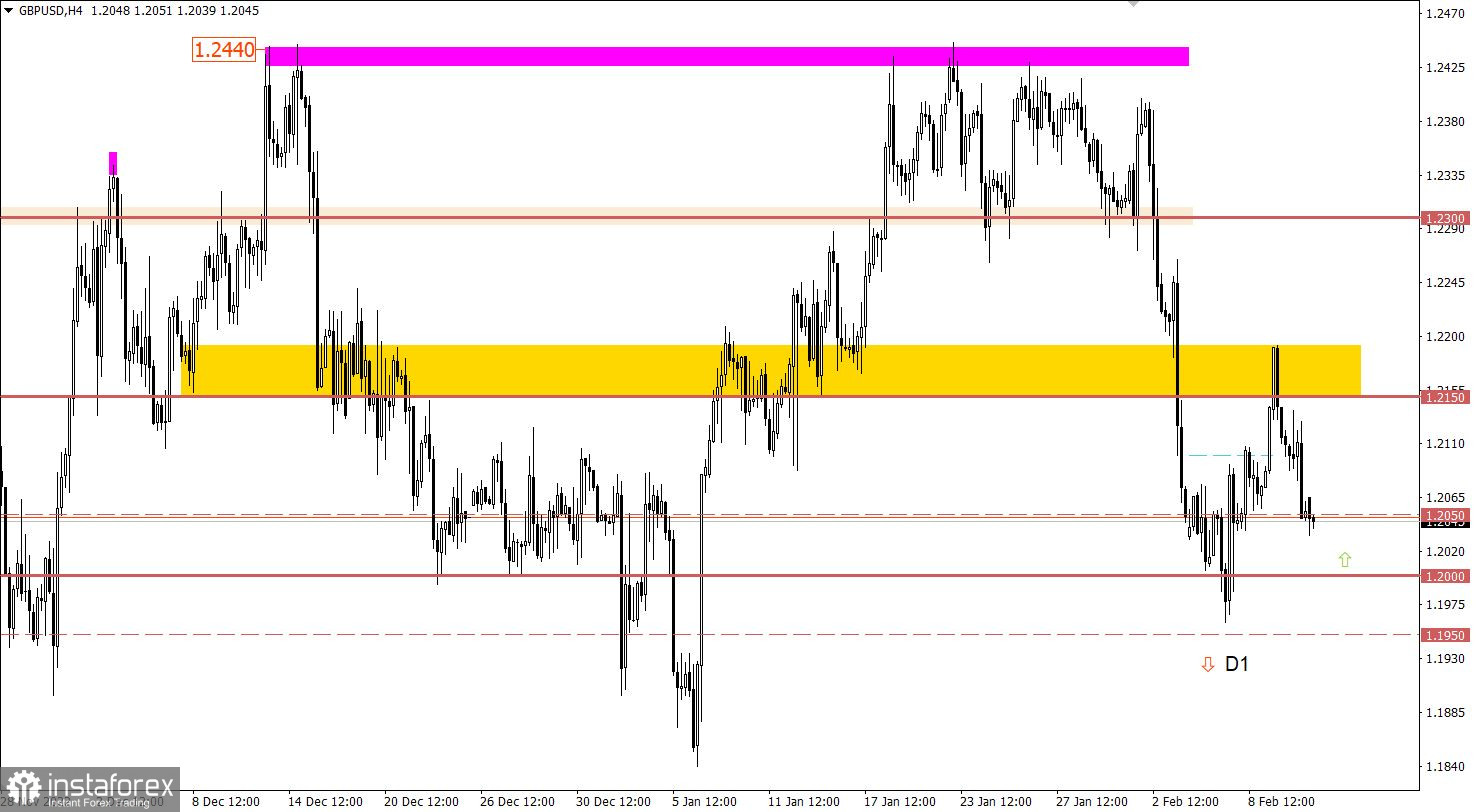
Meanwhile, GBP/USD returned to the psychological level of 1.2000, which indicated the end of the upside cycle at around 1.2150.

Monday is traditionally an uneventful day in the market, marked by an empty macroeconomic calendar.
Therefore, the news flow will be the main driving force for the quotes today.
At this point, consolidation below 1.0650 in the 4-hour time frame at least could cause an increase in selling volumes, which in turn could prolong the corrective move.
Alternatively, if the downtrend cycle slows, the price may retrace and come to a standstill.
Traders will focus on the 1.2000 level. Due to price swings on February 6-7, selling volumes decreased. The 1.2000 mark also serves as support.
We may see a bearish continuation if the price consolidates below 1.1950 in the daily time frame.
The candlestick chart shows graphical white and black rectangles with upward and downward lines. While conducting a detailed analysis of each individual candlestick, it is possible to notice its features intrinsic to a particular time frame: the opening price, the closing price, and the highest and lowest price.
Horizontal levels are price levels, in relation to which a stop or reversal of the price may occur. They are called support and resistance levels.
Circles and rectangles are highlighted examples where the price reversed in the course of its history. This color highlighting indicates horizontal lines which can exert pressure on prices in the future.
Upward/downward arrows signal a possible future price direction.
¡Los informes analíticos de InstaForex lo mantendrá bien informado de las tendencias del mercado! Al ser un cliente de InstaForex, se le proporciona una gran cantidad de servicios gratuitos para una operación eficiente.

