Condiciones de negociación
Products
Herramientas

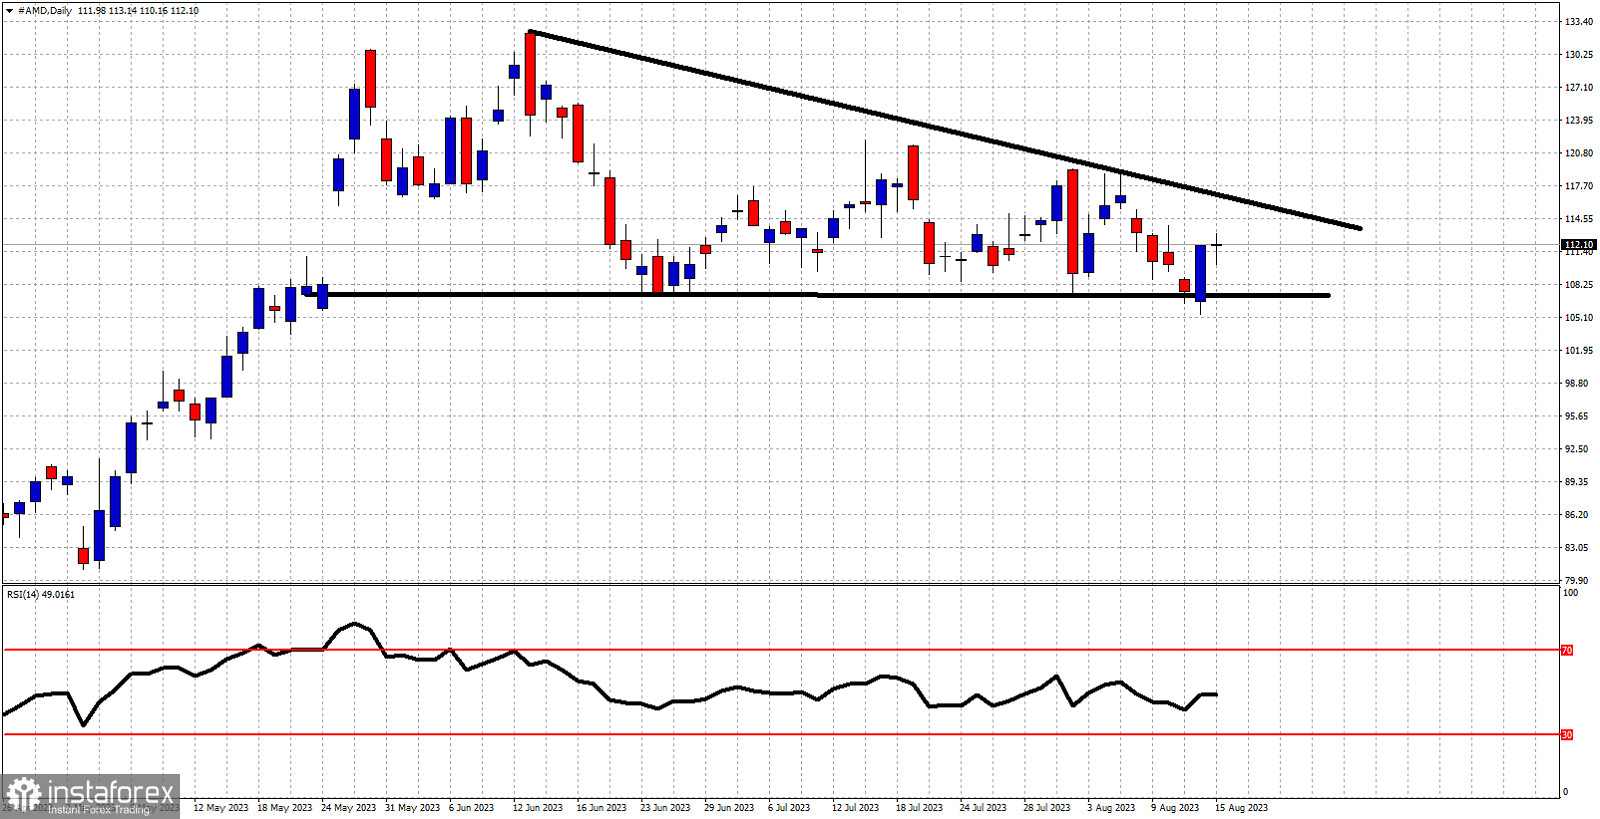
Black lines- descending triangle pattern
AMD stock price continues to trade sideways inside the descending triangle pattern. Price recently got rejected at the upper triangle boundary and as expected moved lower towards the lower boundary of the pattern around $107. Support at $107 has been respected and price is now bouncing off this support level. Resistance is found at $116.35. Support remains key at $107. There is still room for price to continue to trade inside the triangle pattern. Traders need to remain patient.
¡Los informes analíticos de InstaForex lo mantendrá bien informado de las tendencias del mercado! Al ser un cliente de InstaForex, se le proporciona una gran cantidad de servicios gratuitos para una operación eficiente.
Podemos utilizar cookies para analizar los datos de nuestros visitantes, mejorar nuestro sitio web y medir el rendimiento de la publicidad. En general, estos datos se utilizan para ofrecer una mejor experiencia en el sitio web. Más información.
Your IP address shows that you are currently located in the USA. If you are a resident of the United States, you are prohibited from using the services of Instant Trading EU Ltd including online trading, online transfers, deposit/withdrawal of funds, etc.
If you think you are seeing this message by mistake and your location is not the US, kindly proceed to the website. Otherwise, you must leave the website in order to comply with government restrictions.
Why does your IP address show your location as the USA?
Please confirm whether you are a US resident or not by clicking the relevant button below. If you choose the wrong option, being a US resident, you will not be able to open an account with InstaForex anyway.
We are sorry for any inconvenience caused by this message.
 Permanecer


