 Permanecer
Condiciones de negociación
Products
Herramientas


The number of jobs in the U.S. rose significantly in February this year, which may be the reason for further tightening of the Federal Reserve's policy. However, the pace of wage growth is showing signs of slowing. According to a report from the U.S. Labor Department, nonfarm payrolls increased by 311,000 last month, with January's data revised downward. Economic circles had expected job growth of 205,000, but more jobs were created than forecast. Average hourly earnings rose 0.2% from 0.3% in January, pushing annualized wage growth to 4.6%. However, the unemployment rate rose to 3.6% from 3.4% in January, which may cause the Fed to raise its rate at the upcoming meeting by only 25 basis points, as speculators hoped. The market reaction was appropriate; the dollar weakened sharply.
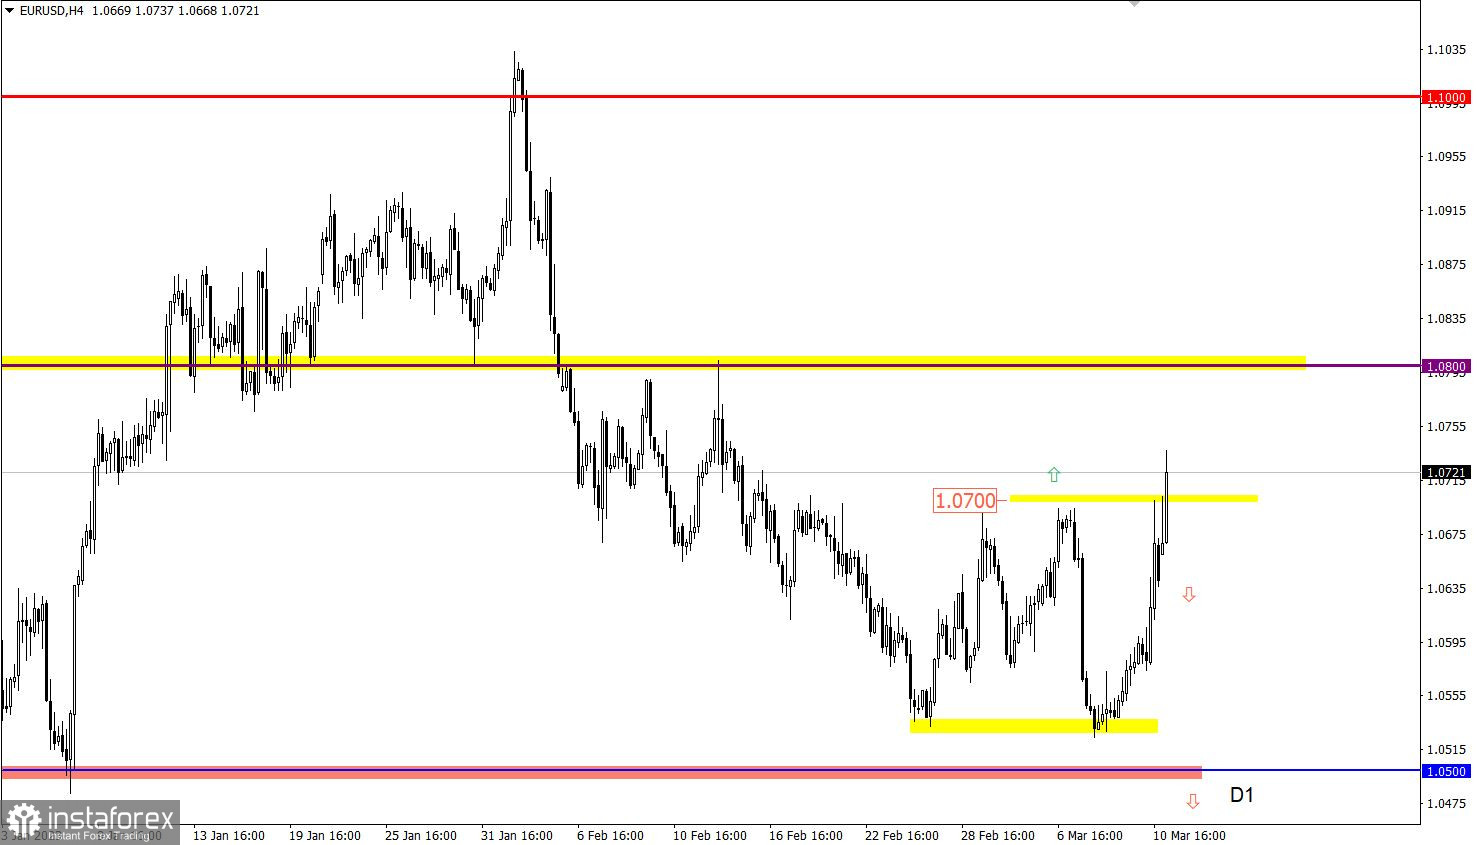
EURUSD gained about 100 pips last Friday, caused by the massive reduction of dollar positions due to the release of the U.S. labor market data. As a result, the quote has updated the local highs of the week.
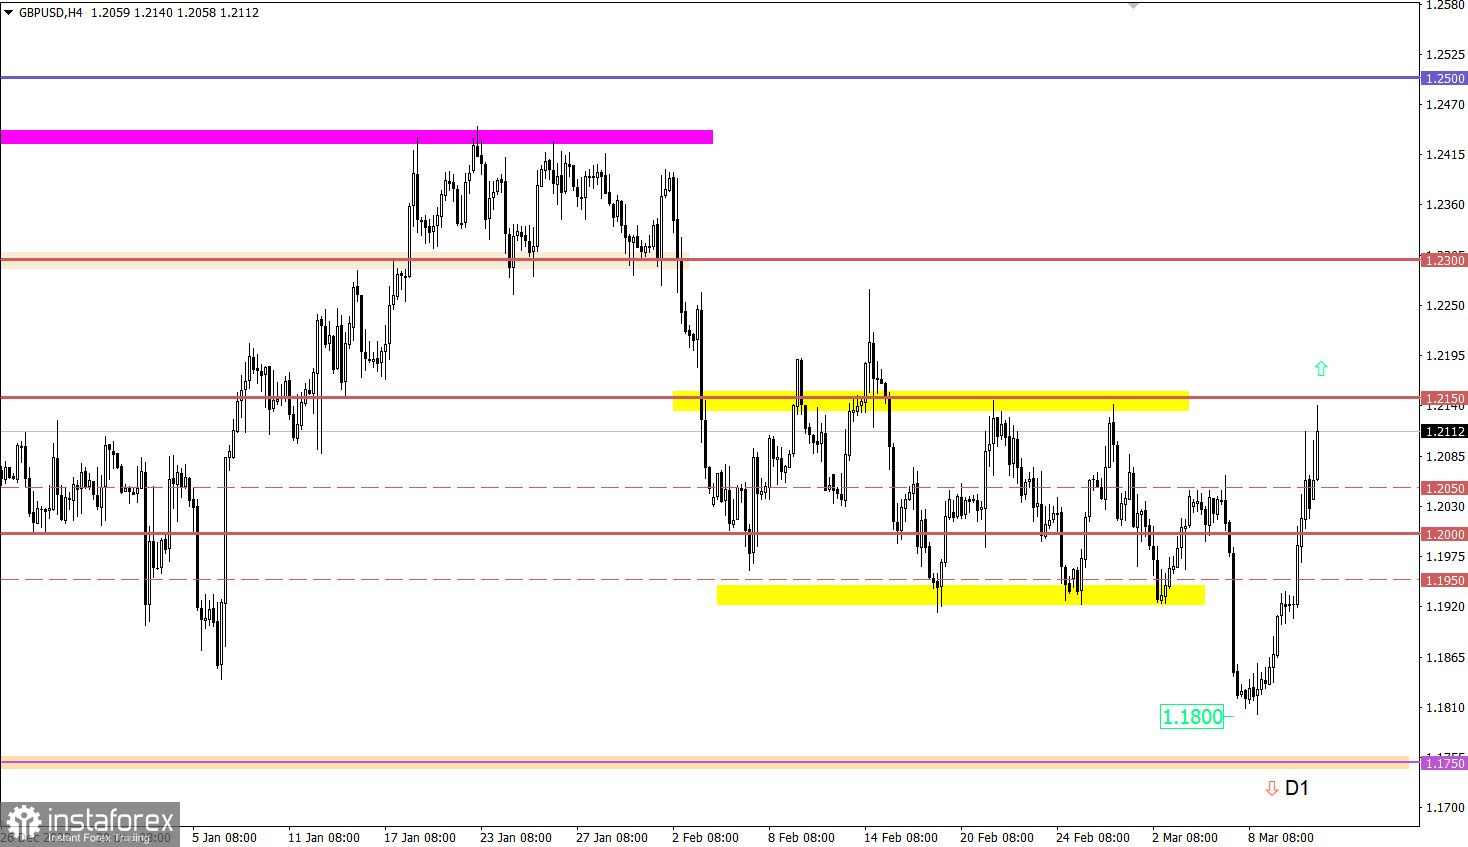
GBPUSD almost reached the 1.2150 resistance level during the upward impulse, where there was a decrease in the volume of long positions. As a result, the pound sterling not only recovered after the recent fall, but also set a new local high of the month.

The economic calendar is traditionally empty on Monday. No important reports are expected in the EU, the United Kingdom, and the Unites States.
In this regard, investors and traders focused on the incoming information and news flow. Hot Topics: inflation, interest rates, problems in the U.S. banking sector, U.S. Department of Labor report.
Particular attention should be paid to the Federal Reserve's (Fed) upcoming closed-door meeting, scheduled for today at 16:30 UTC. Information about this event became known only on Saturday (March 11). There are rumors that the meeting is related to problems in the banking sector and the overheated labor market in the USA.
In this situation, stable price retention above the value of 1.0700 may lead to a subsequent growth of the euro, while ignoring the technical signal that it is overbought in the short term. However, the situation may change if the quote returns below 1.0650.
Based on the price fluctuations, we can see that the quotes returned to the range established recently around the levels 1.1920/1.2150. This situation may indicate the prevailing upward mood among market participants. In the long term, it may lead to an increase in the volume of long positions in the pound sterling. To strengthen the upward mood, it is necessary that the quotes hold above the level of 1.2150, at least for a four-hour period. Otherwise, further price fluctuations within the current boundaries are possible.
The candlestick chart type is white and black graphic rectangles with lines above and below. With a detailed analysis of each individual candle, you can see its characteristics relative to a particular time frame: opening price, closing price, intraday high and low.
Horizontal levels are price coordinates, relative to which a price may stop or reverse its trajectory. In the market, these levels are called support and resistance.
Circles and rectangles are highlighted examples where the price reversed in history. This color highlighting indicates horizontal lines that may put pressure on the asset's price in the future.
The up/down arrows are landmarks of the possible price direction in the future.
¡Los informes analíticos de InstaForex lo mantendrá bien informado de las tendencias del mercado! Al ser un cliente de InstaForex, se le proporciona una gran cantidad de servicios gratuitos para una operación eficiente.


