 Permanecer
Condiciones de negociación
Products
Herramientas


Despite the holiday in Europe and the United Kingdom yesterday, the market showed activity thanks to working traders in the United States. In the U.S., the manufacturing sector business activity index was published, which turned out better than expected, rising from 46.3 to 47.1 points, with a forecast of 46.8 points.
There was also noise in the market about the saga with First Republic Bank, which was sold to JPMorgan Chase.
The market's reaction to the statistical data and the news background led to an increase in the value of the U.S. dollar.
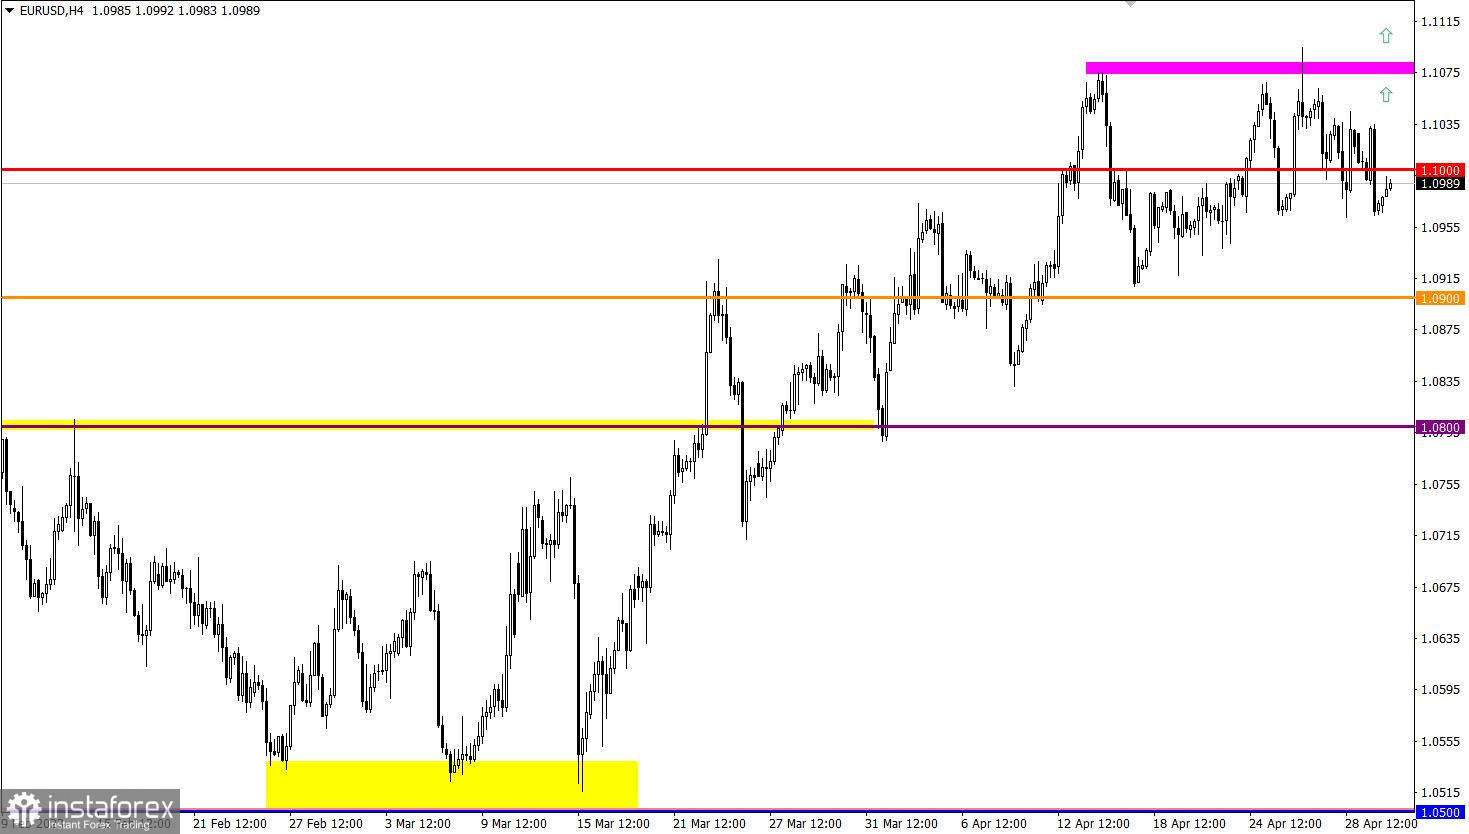
Although EUR/USD began to decline at the beginning of the new trading week, its quote is still around the 1.1000 level, and no radical changes are observed on the trading chart.
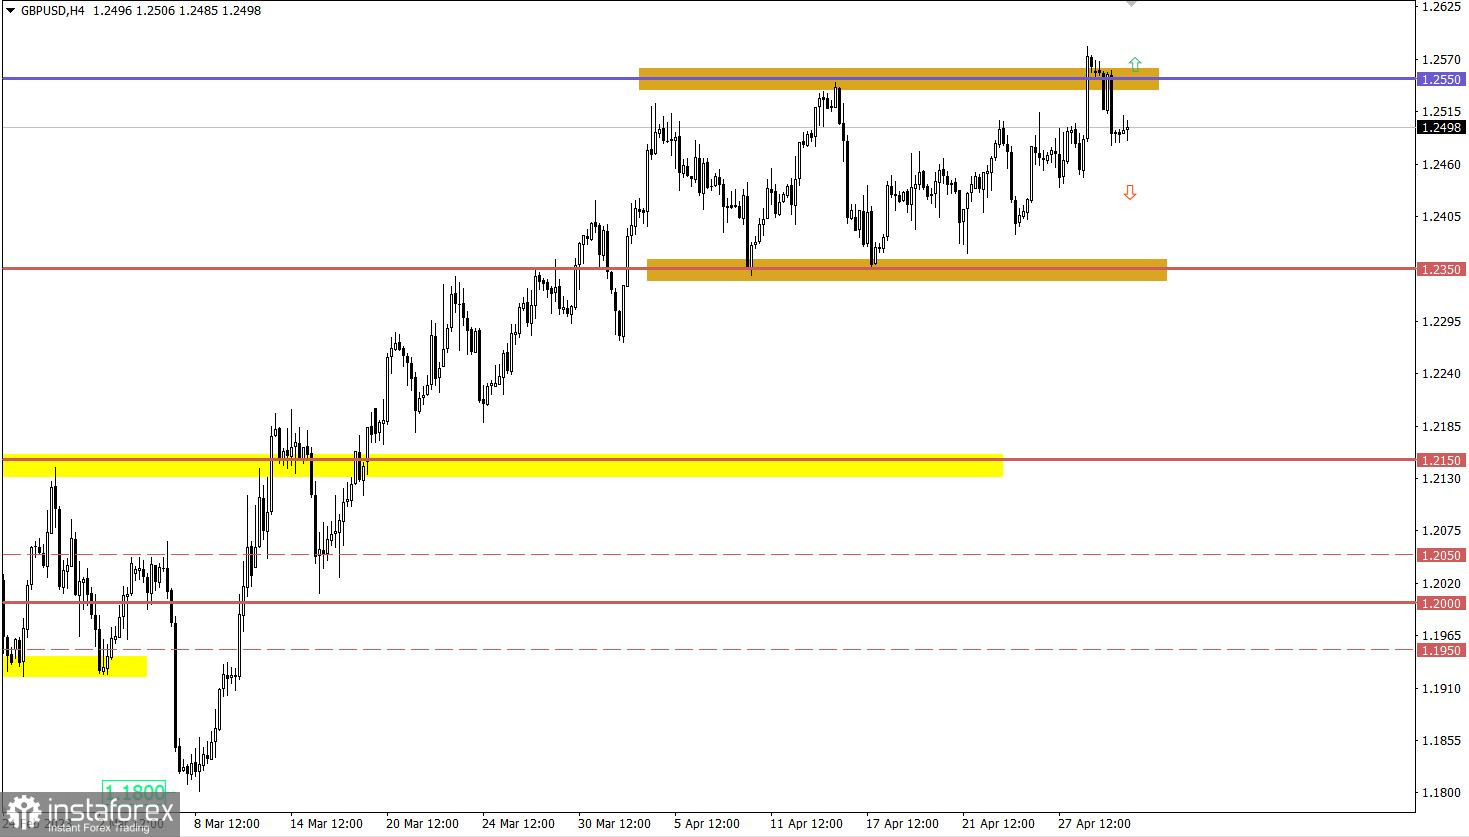
GBP/USD started the new trading week with a pullback. This happened due to the updating of the local high of the medium-term upward trend, which caused a sharp jump in the volume of long positions. In fact, this led first to the overheating of long positions on the pound and then to a price pullback.

One of the main events of Tuesday will be the release of preliminary estimate of inflation in Europe. Economists forecast an increase in the indicator from 6.9% to 7.0%. If this forecast is confirmed, it indicates a possible further tightening of the European Central Bank's monetary policy, which could lead to higher interest rates.
Thus, the euro may receive support from buyers.
Time targeting:
EU Inflation – 09:00 UTC
In the current situation, there is no clear technical signal for the completion of the upward cycle. This means that a return of the price above the 1.1050 level could lead to a new growth in the volume of long positions, which could lead to an update of the local high of the medium-term trend.
Regarding the downward scenario, it is necessary for the quote to hold below the 1.0940 mark. If this happens, there is a risk of the price transitioning to a full-fledged correction.
The fact of updating the local high of the medium-term trend indicates the preservation of the upward sentiment among market participants. However, the current pullback can be seen as a stage of regrouping of trading forces, as a result of which the quote is temporarily under pressure from sellers. New growth in the volume of long positions is possible only after the price returns above the 1.2550 mark. This time, the probability of a pullback will be low.
The candlestick chart type is white and black graphic rectangles with lines above and below. With a detailed analysis of each individual candle, you can see its characteristics relative to a particular time frame: opening price, closing price, intraday high and low.
Horizontal levels are price coordinates, relative to which a price may stop or reverse its trajectory. In the market, these levels are called support and resistance.
Circles and rectangles are highlighted examples where the price reversed in history. This color highlighting indicates horizontal lines that may put pressure on the asset's price in the future.
The up/down arrows are landmarks of the possible price direction in the future.
¡Los informes analíticos de InstaForex lo mantendrá bien informado de las tendencias del mercado! Al ser un cliente de InstaForex, se le proporciona una gran cantidad de servicios gratuitos para una operación eficiente.

