 Permanecer
Condiciones de negociación
Products
Herramientas


Our main forecast is based on the expectation of a resumption of growth for XAU/USD. In the current situation of uncertainty, many economists predict an increase in demand for safe-haven assets, particularly gold.
From a technical perspective, XAU/USD is developing a short-term downward dynamics towards key support levels: 1905.00 (144 EMA on the daily chart), 1896.00 (61.8% Fibonacci level in the downward correction wave from its peak at 2070.00 to its low at 1615.00), and 1882.00 (200 EMA on the daily chart).
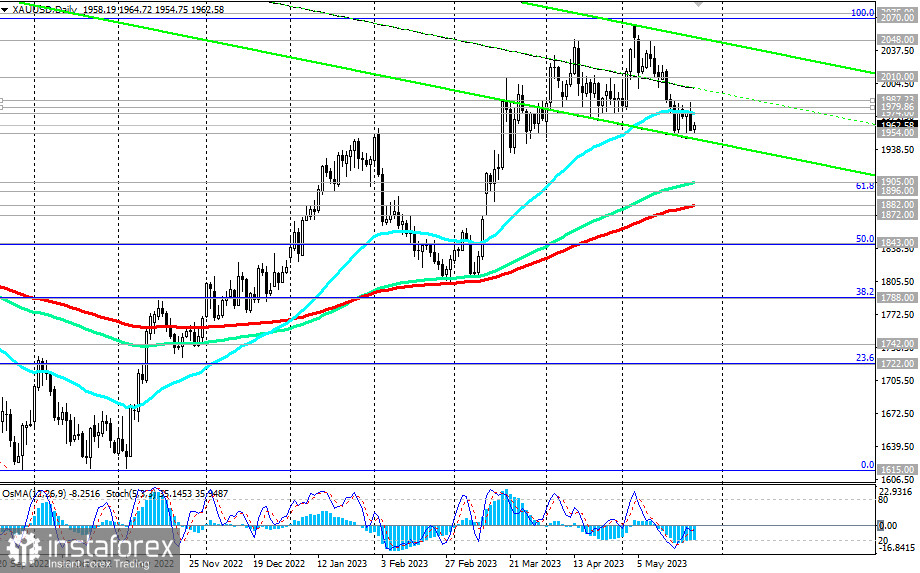
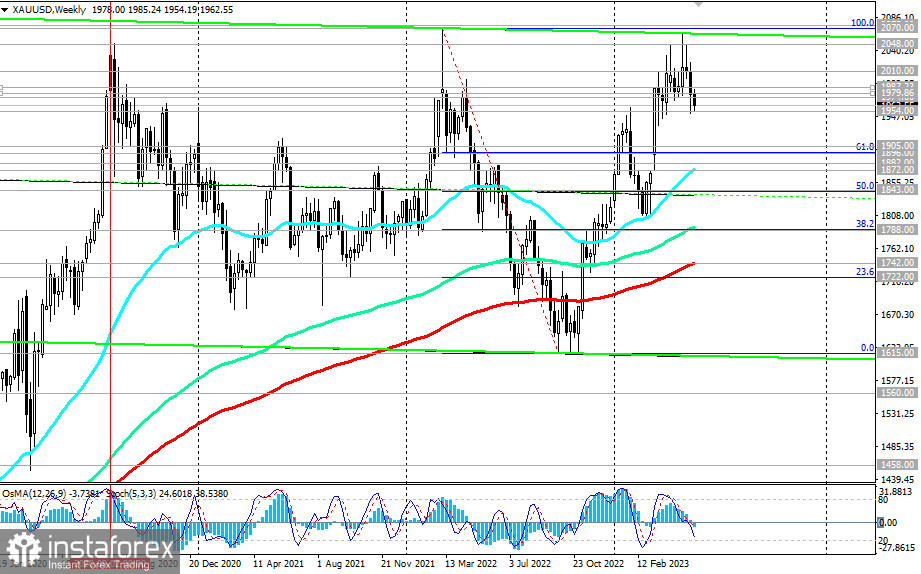
A break below the local support level 1954.00 could activate this downward scenario for XAU/USD. In such a case, a break below the support level of 1872.00 (50 EMA on the weekly chart) and further decline would indicate a break in the medium-term bullish trend.
For now, as long as it remains above the key support levels of 1788.00 (144 EMA on the weekly chart and 38.2% Fibonacci level), 1742.00 (200 EMA on the weekly chart), and 1722.00 (23.6% Fibonacci level), XAU/USD remains within the long-term bullish market zone.
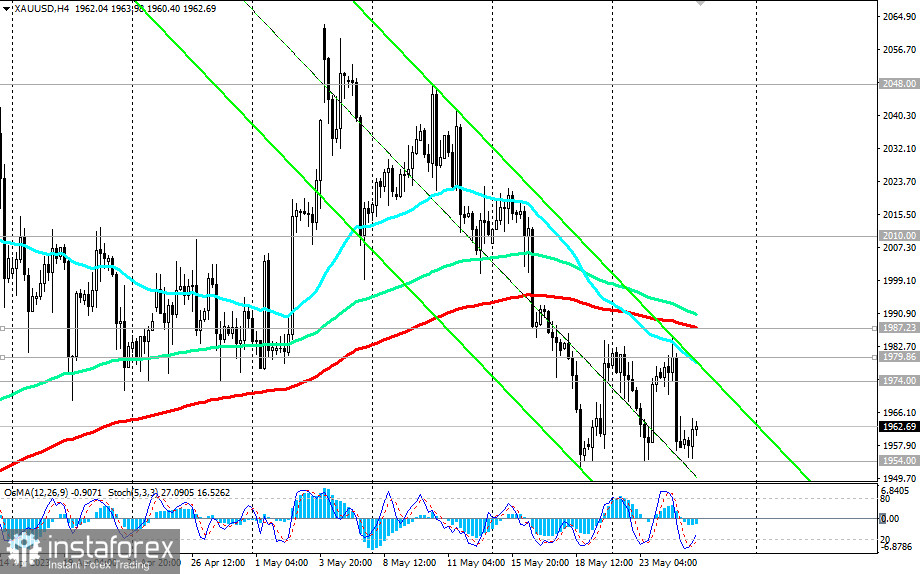
A break above the 1974.00 resistance level could serve as the first signal for a resumption of long positions, with breakouts above the resistance levels of 1980.00 (200 EMA on the 1-hour chart) and 1987.00 (200 EMA on the 4-hour chart) confirming the trend.
Support levels: 1954.00, 1905.00, 1896.00, 1882.00, 1872.00, 1843.00, 1800.00, 1788.00, 1742.00, 1722.00
Resistance levels: 1974.00, 1980.00, 1987.00, 2000.00, 2010.00, 2048.00, 2070.00, 2077.00
¡Los informes analíticos de InstaForex lo mantendrá bien informado de las tendencias del mercado! Al ser un cliente de InstaForex, se le proporciona una gran cantidad de servicios gratuitos para una operación eficiente.

