 Permanecer
Condiciones de negociación
Products
Herramientas


U.S. inflation for June was lower than forecasted, standing at 3% compared to 4% in May, which is the lowest since March 2021. This prolonged slowdown in inflation could lead to an early end of the Federal Reserve's monetary policy tightening cycle. Nonetheless, a rate hike is expected this month. According to data from the Chicago Mercantile Exchange, 89.9% of analysts expect the Fed to raise rates by 0.25% in July from the current level of 5–5.25%. However, at the next Fed meeting in September, 77.8% of analysts believe the key rate will remain unchanged.
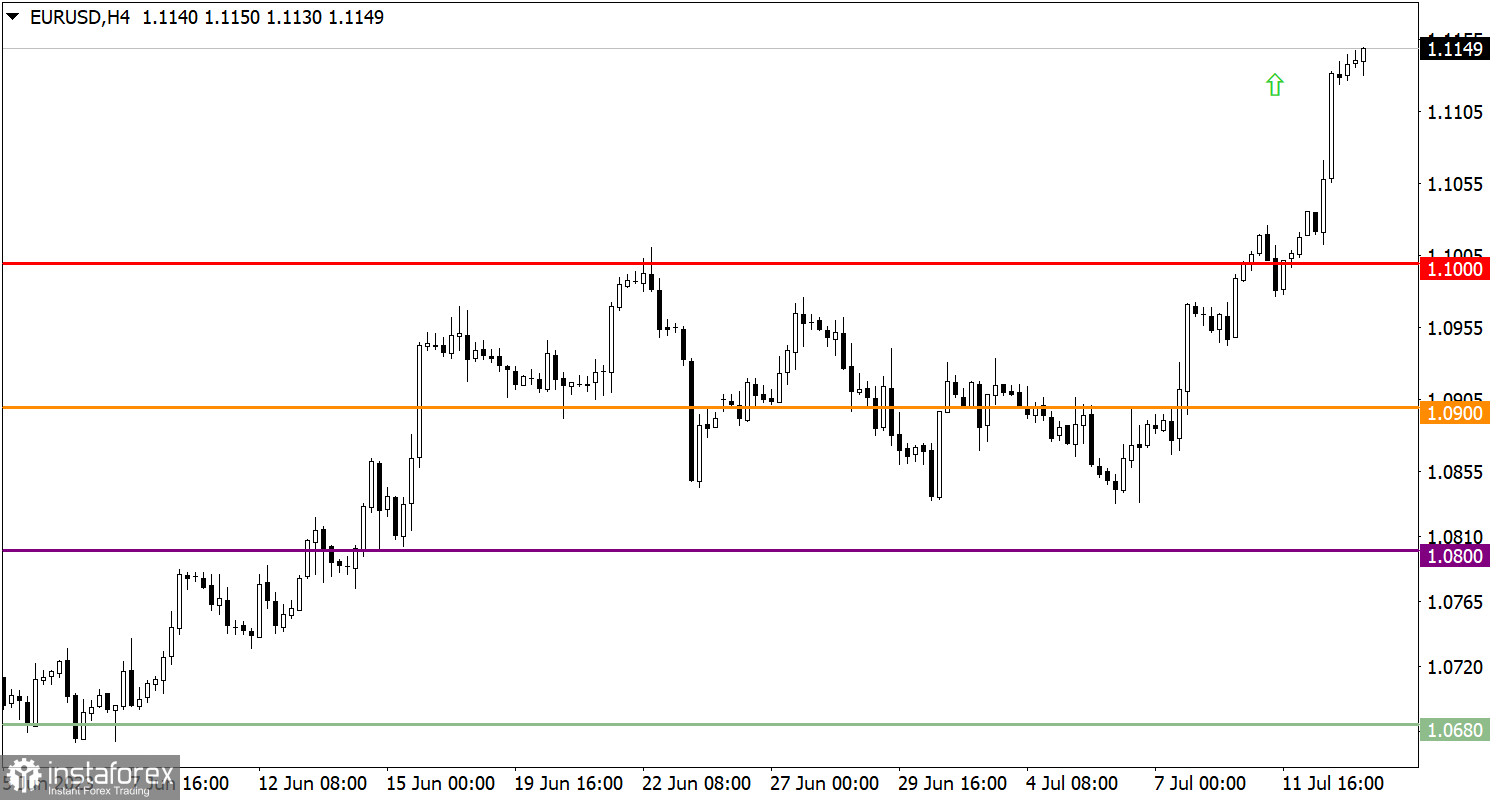
The EUR/USD currency pair continues its intense upward movement and has reached a new local high in the medium-term trend. Since the beginning of July, the rate has risen by approximately 300 points.
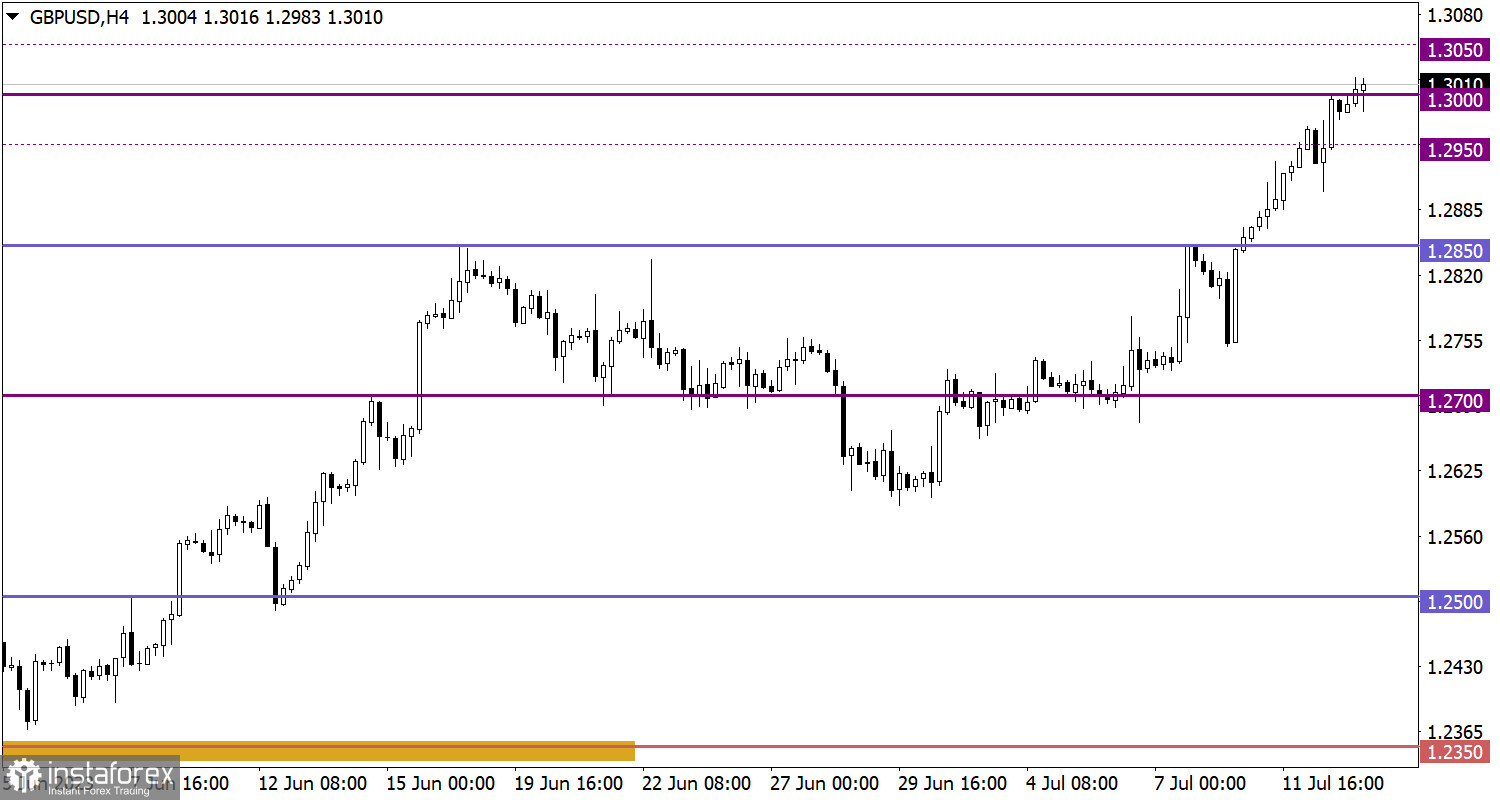
The GBP/USD pair also continues its inertial movement and has overcome the 1.3000 level. Since the beginning of July, the pound has strengthened by about 350 points. This is a significant price change, especially considering the absence of significant pullbacks during this period.
At the start of the European session, UK industrial production data was published, reflecting an acceleration in the rate of decline from -1.6% to -2.3%, slightly better than the -2.4% forecast. A similar indicator is expected for the EU, where industrial production growth of 0.2% should be replaced by a decline of -2.3%. This is a negative factor for the economy, which could weaken the euro rate if the data matches expectations.
During the American trading session, the publication of the Producer Price Index in the United States is expected, which according to forecasts, could decline from 1.1% to 0.2%. Thus, inflation in the United States will continue to decline, which is a negative factor for the dollar.
In the current situation, an inertial movement is observed, during which traders can ignore the overbought status, relying on other technical tools. In this case, the continuation of the quote's growth and reaching the next resistance level at 1.1200 is possible. However, it should be noted that inertial movements related to speculation can be unstable. At any moment, the fixation of long positions can occur, which could lead to a price pullback.
According to technical analysis, overheating of long positions could lead to their fixation and the emergence of a pullback from the psychological level. However, speculators may ignore technical signals of overbought conditions and continue trading within the 1.3000 level, which could serve as the basis for further inertial growth. Key signal values are deviations from the psychological level: price retention below 1.2950 could indicate a pullback formation, while price retention above 1.3050 could lead to an increase in the volume of long positions.
The candlestick chart type is white and black graphic rectangles with lines above and below. With a detailed analysis of each individual candle, you can see its characteristics relative to a particular time frame: opening price, closing price, intraday high and low.
Horizontal levels are price coordinates, relative to which a price may stop or reverse its trajectory. In the market, these levels are called support and resistance.
Circles and rectangles are highlighted examples where the price reversed in history. This color highlighting indicates horizontal lines that may put pressure on the asset's price in the future.
The up/down arrows are landmarks of the possible price direction in the future.
¡Los informes analíticos de InstaForex lo mantendrá bien informado de las tendencias del mercado! Al ser un cliente de InstaForex, se le proporciona una gran cantidad de servicios gratuitos para una operación eficiente.


