 Permanecer
Condiciones de negociación
Products
Herramientas


Data on U.S. jobless claims indicates an increase in their overall volume. Details of the statistics show that the number of continuing claims has risen from 1.684 million to 1.716 million, while the number of initial claims fell from 250,000 to 239,000.
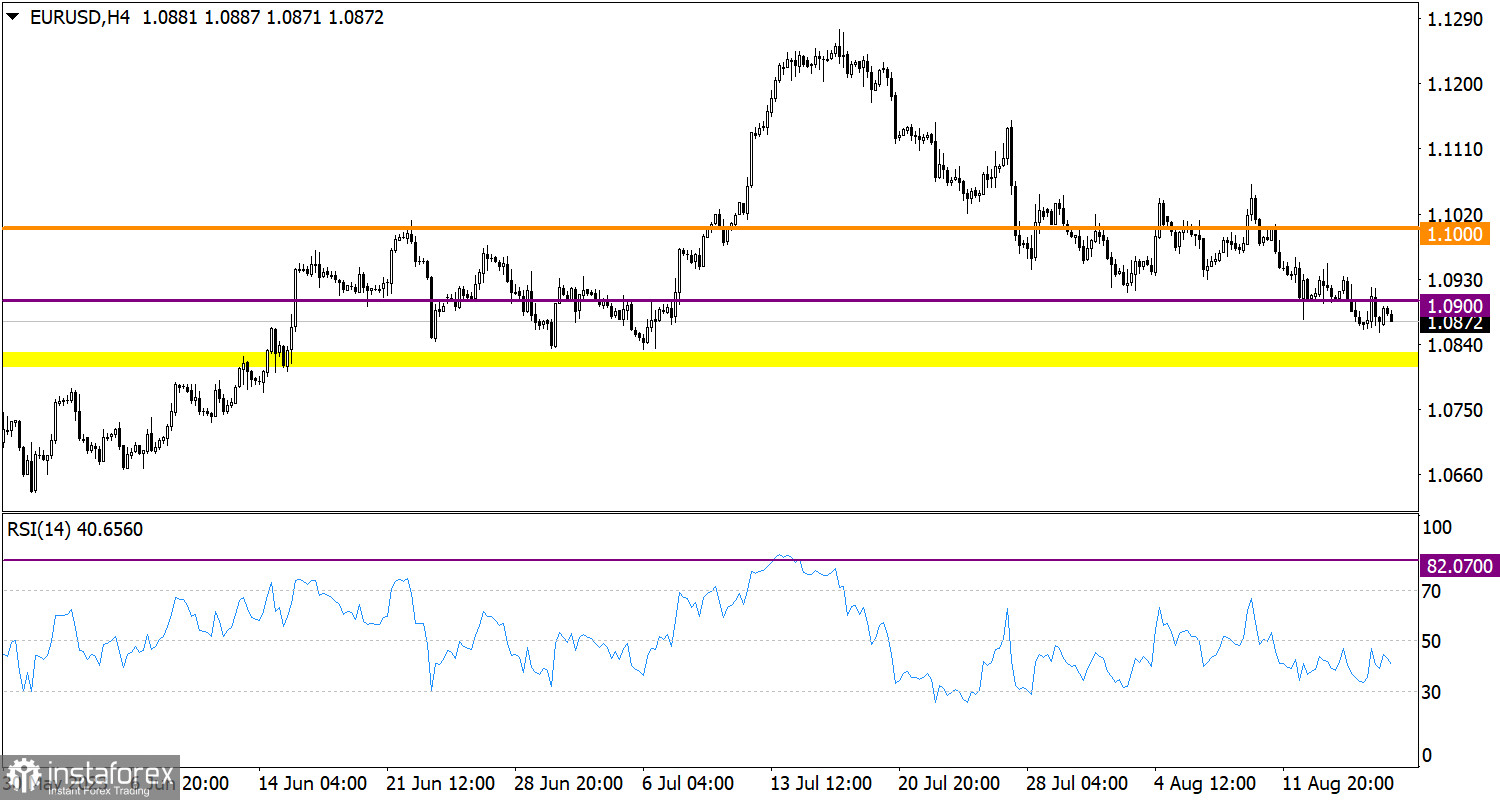
EUR/USD has slowed near the base of the current correction cycle. Despite the overall scale of the correction, which amounts to more than 400 points, the downward trend still predominates in the market.
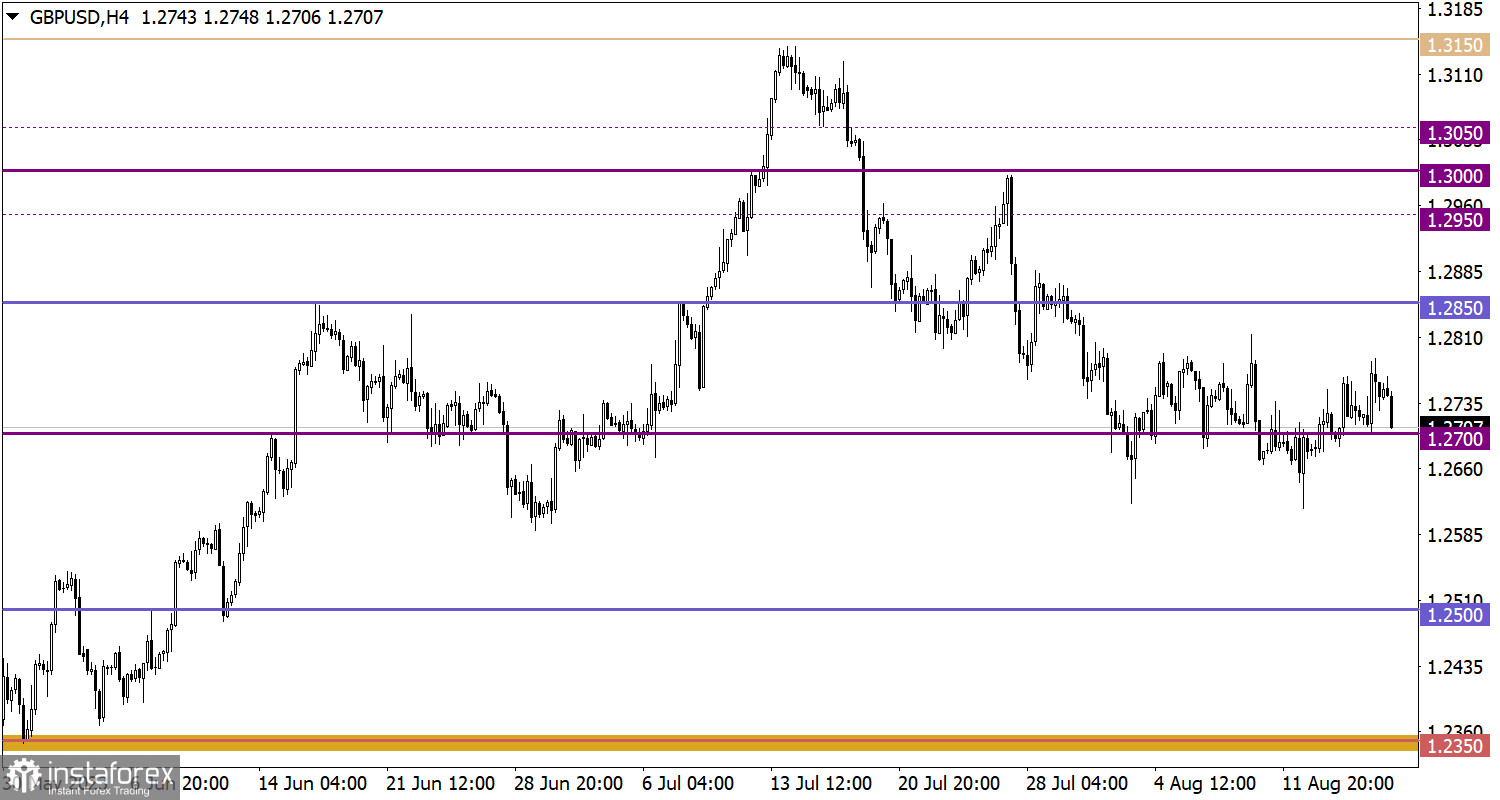
GBP/USD has been in a sideways movement for the third week in a row, with an amplitude of approximately 150 points. This type of movement may indicate the accumulation of trading forces before a possible significant price change.
Since the opening of European trading platforms, data on retail sales in the UK have been published, showing a stronger decline, reaching -3.2%. As a result of this news, the value of the pound sterling fell. In the European Union, the final data on the inflation rate is expected to be published. However, these data have already been taken into account by the market at the time of the preliminary assessment. If the final data differs from the preliminary ones, it may attract the attention of speculators.
If the price consistently holds below the 1.0900 level, it may facilitate the strengthening of short positions, which, in turn, could lead to a further decline in the exchange rate. In this scenario, the euro may decline to 1.0800/1.0850.
On the other hand, the alternative scenario suggests that traders are considering the possibility of a slowdown in the correction cycle's pace, transitioning to a sideways movement.
If the quote continues to hold steadily below the 1.2650 mark, it could stimulate a downward scenario associated with the continuation of the correction movement. This, in turn, could provoke an increase in short positions and may even lead to the update of the local low. On the other hand, the upward scenario implies a gradual recovery in the value of the pound sterling within the current correction. A possible initial technical signal for an upward scenario could appear if the price holds above 1.2800 during the daily period.
The candlestick chart type is white and black graphic rectangles with lines above and below. With a detailed analysis of each individual candle, you can see its characteristics relative to a particular time frame: opening price, closing price, intraday high and low.
Horizontal levels are price coordinates, relative to which a price may stop or reverse its trajectory. In the market, these levels are called support and resistance.
Circles and rectangles are highlighted examples where the price reversed in history. This color highlighting indicates horizontal lines that may put pressure on the asset's price in the future.
The up/down arrows are landmarks of the possible price direction in the future.
¡Los informes analíticos de InstaForex lo mantendrá bien informado de las tendencias del mercado! Al ser un cliente de InstaForex, se le proporciona una gran cantidad de servicios gratuitos para una operación eficiente.


