 Permanecer
Condiciones de negociación
Products
Herramientas


The total volume of U.S. jobless claims declined, which can be interpreted as a positive signal for the American labor market. Against this background, the dollar began to strengthen. Although, it is likely that the primary stimulus for the rise in the dollar's value were numerous statements from the Federal Reserve System representatives, which essentially imply that the ceiling for raising interest rates has not yet been reached.
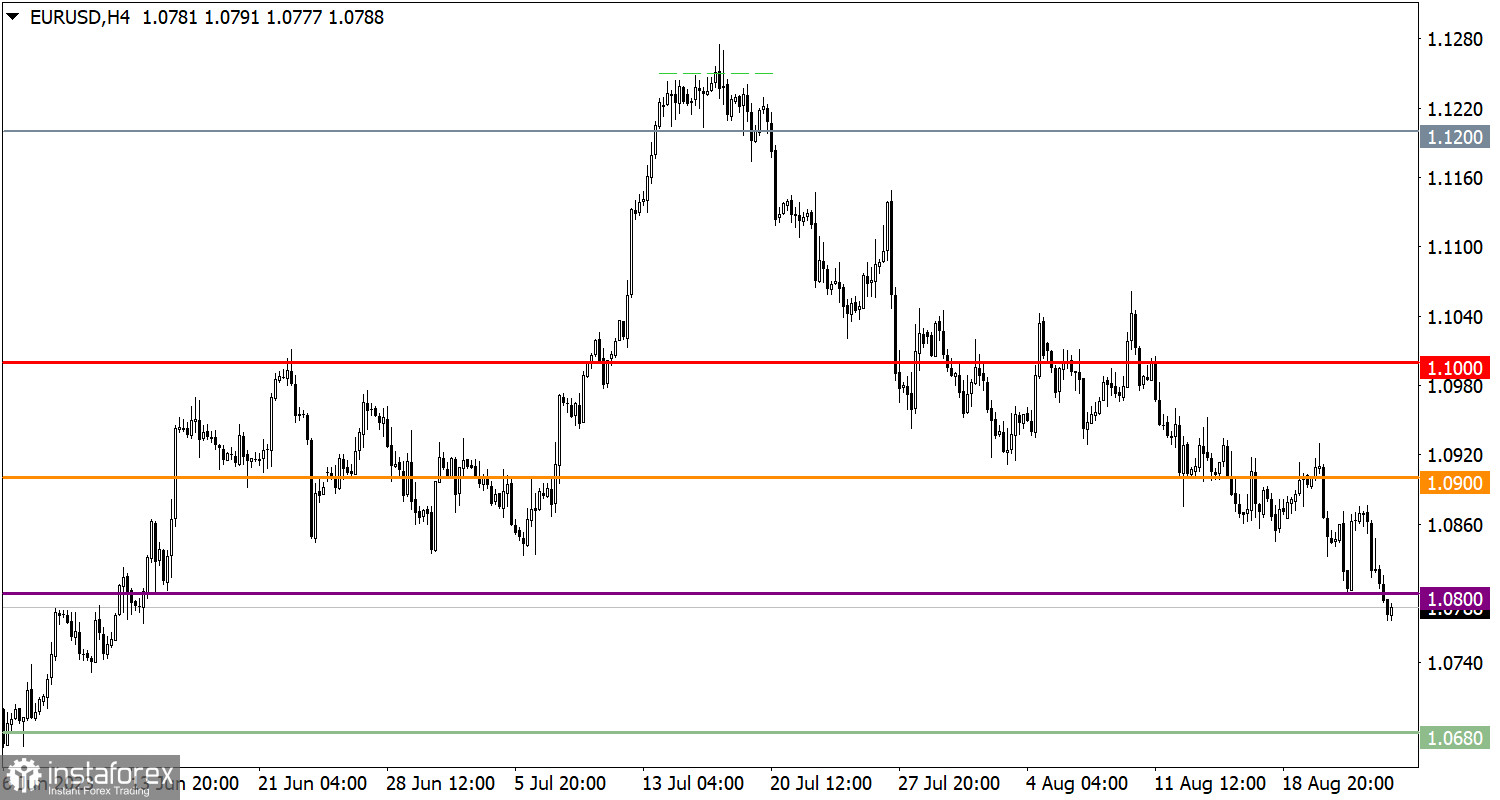
The EUR/USD exchange rate continued to fall, leading to the support level of 1.0800 being breached, and as a result, the corrective cycle continued.
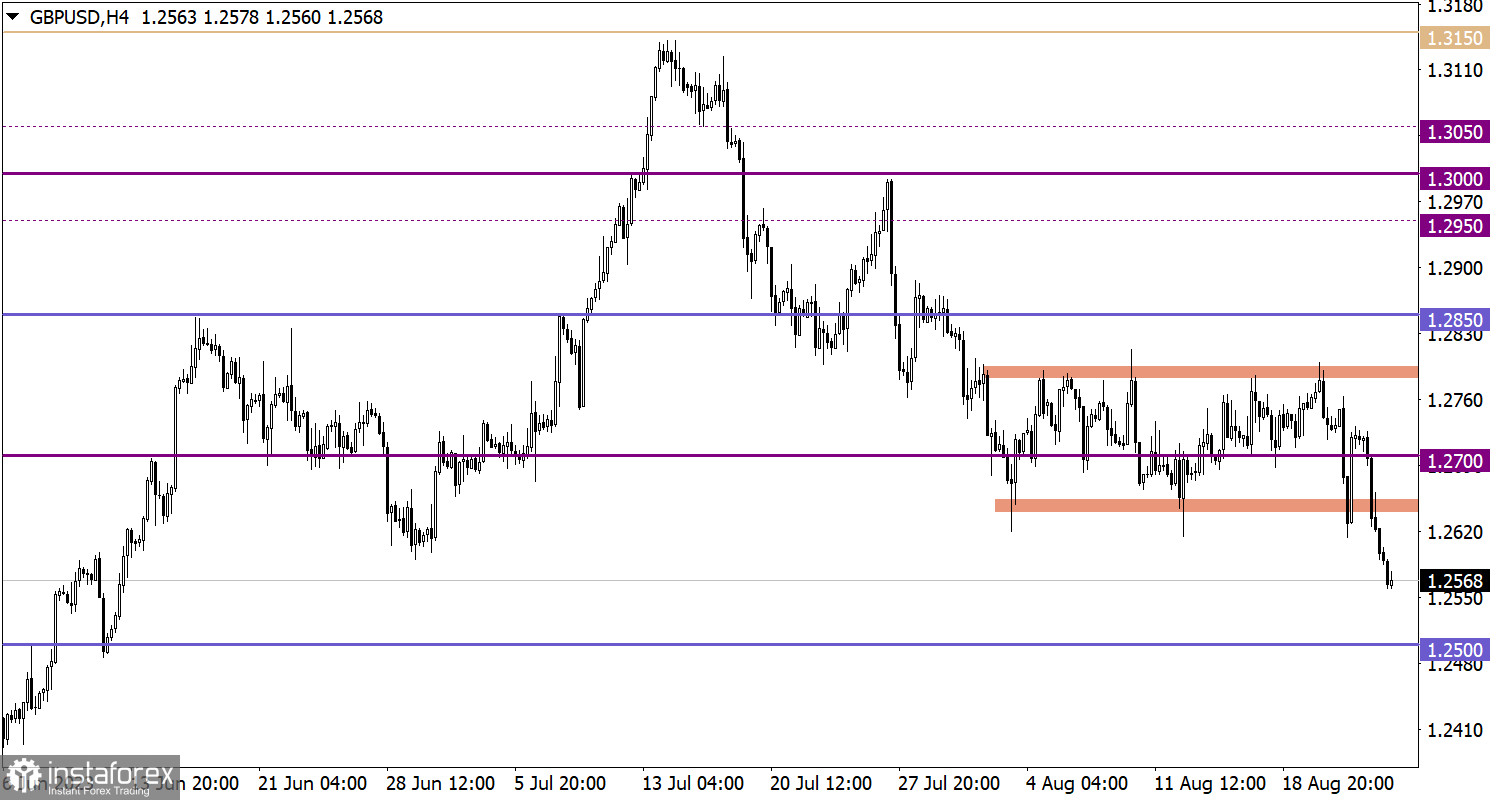
The GBP/USD currency pair completed the formation of a three-week sideways channel of 1.2650/1.2800, breaking through its lower limit. This event triggered an increase in short positions on the British pound, amplifying the current downward cycle.

Today, Fed Chairman Jerome Powell will give a speech at the annual economic symposium in Jackson Hole. This forum gathers representatives from central banks and leading economists. The event will cover key topics such as inflation, interest rates, recession, and other important aspects. Therefore, it's essential to closely follow the news to stay updated on the current situation.
If the price continues to hold below the 1.0800 level, this might trigger an increase in short positions. In such a case, further formation of a corrective cycle towards the local low set in May might occur. However, it is worth noting that there is an oversold level of the euro in the short-term and intraday perspective. This technical signal might prompt the closure of short positions and, as a result, a partial recovery of the euro rate.
Considering the significant weakening of the British pound during the previous day, it can be assumed that short positions are near overheating, which may lead to a technical pullback. The support level of 1.2550, which the rate has recently approached, can be considered as a potential foundation here. However, if the price shows inertia, it might overlook technical signals of being oversold. In such a case, if the price remains below the 1.2550 level, it might trigger further decline in the rate.
The candlestick chart type is white and black graphic rectangles with lines above and below. With a detailed analysis of each individual candle, you can see its characteristics relative to a particular time frame: opening price, closing price, intraday high and low.
Horizontal levels are price coordinates, relative to which a price may stop or reverse its trajectory. In the market, these levels are called support and resistance.
Circles and rectangles are highlighted examples where the price reversed in history. This color highlighting indicates horizontal lines that may put pressure on the asset's price in the future.
The up/down arrows are landmarks of the possible price direction in the future.
¡Los informes analíticos de InstaForex lo mantendrá bien informado de las tendencias del mercado! Al ser un cliente de InstaForex, se le proporciona una gran cantidad de servicios gratuitos para una operación eficiente.

