 Permanecer
Condiciones de negociación
Products
Herramientas


The pace of the decline in retail sales in the Eurozone in July slowed from -1.4% to -1.0%, which corresponds to market expectations. Nevertheless, it should be noted that the previous figure was revised from -1.4% to -1.0%. Despite this, it can be formally stated that there is an improvement in the situation, which may have limited the extent of the euro's depreciation.
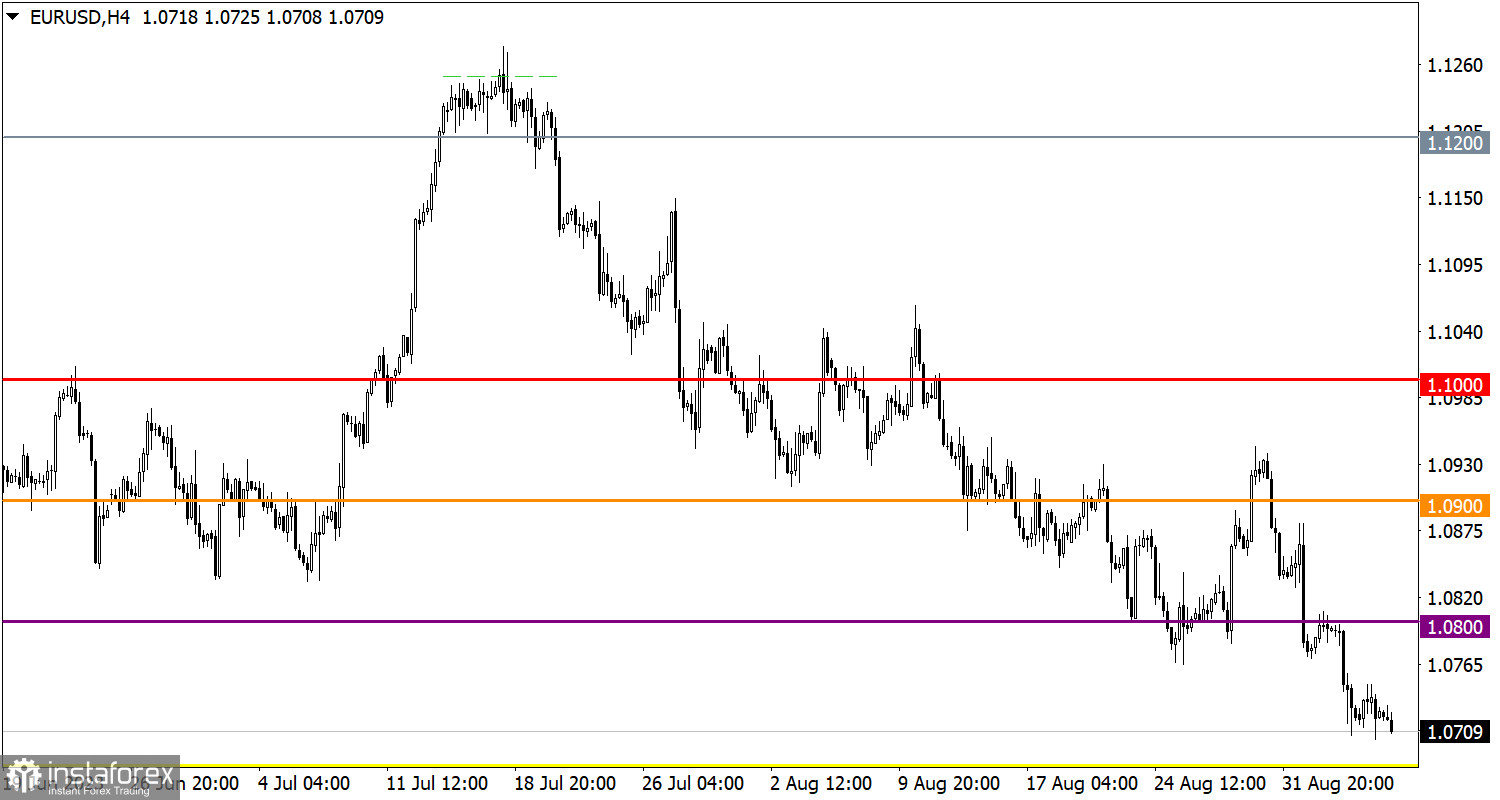
The EUR/USD exchange rate remains under pressure from sellers, confirmed by the stable price retention around the base of the downward cycle.
The GBP/USD currency pair has updated the low of the downward cycle during its inertial movement, reaching the level of 1.2500. This indicates the prevailing interest of traders in dollar positions and pressure on the British pound.

Today, the final estimate of GDP in the European Union for the second quarter is expected to be published. However, it's worth noting that these data will repeat the preliminary estimate, so strong market reactions are not expected.
During the American trading session, data on jobless claims in the United States is also expected to be released, and forecasts indicate a slight increase in the overall figure. Detailed statistical data show that the volume of continuing claims for unemployment benefits may decline from 1.725 million to 1.715 million, while the volume of initial claims for unemployment benefits may rise from 228,000 to 234,000.
Time targeting:
EU GDP – 09:00 UTC
U.S. Jobless Claims – 12:30 UTC
To continue the decline of the euro's exchange rate, it requires a sustained holding of its value below the level of 1.0700. In this case, speculators may ignore technical signals of euro's oversold conditions, and the quote may start a new phase of decline, heading towards the low observed in June. As for the scenario of the euro's rate recovery, some technical signals indicating a possible rebound are already visible. However, in the case of continuing the downward cycle, this rebound may be postponed to the levels of 1.0650/1.0680, where various trading forces interact.
A stable price retention below the level of 1.2500 can strengthen the current downward trend, and traders may disregard some technical signals of the pound's oversold condition. In this case, momentum movement can lead to further price decline towards the 1.2350 support level.
On the other hand, the upward scenario is always under consideration by traders, especially considering the technical signal of oversold conditions. Sooner or later, this could lead to the closure of short positions, which could lead to a partial recovery in the value of the British currency.

The candlestick chart type is white and black graphic rectangles with lines above and below. With a detailed analysis of each individual candle, you can see its characteristics relative to a particular time frame: opening price, closing price, intraday high and low.
Horizontal levels are price coordinates, relative to which a price may stop or reverse its trajectory. In the market, these levels are called support and resistance.
Circles and rectangles are highlighted examples where the price reversed in history. This color highlighting indicates horizontal lines that may put pressure on the asset's price in the future.
The up/down arrows are landmarks of the possible price direction in the future.
¡Los informes analíticos de InstaForex lo mantendrá bien informado de las tendencias del mercado! Al ser un cliente de InstaForex, se le proporciona una gran cantidad de servicios gratuitos para una operación eficiente.


