 Permanecer
Condiciones de negociación
Products
Herramientas


The data on inflation in the United Kingdom pleasantly surprised speculators. The Consumer Price Index was expected to rise from 6.8% to 7.0% (year on year), but it decreased to 6.7%. In light of these unexpected statistical data, expectations regarding the upcoming Bank of England meeting shifted towards anticipating a more accommodative monetary policy.
The British pound reacted accordingly and experienced local weakening during the data release.
The first autumn meeting of the Federal Reserve System was considered the main event of this week and the entire month. As expected, the regulator kept the key interest rate unchanged at 5.5%, the highest level in 22 years and the second rate hike in the current cycle.
The decision on the interest rate was unanimous. The regulator is closely monitoring inflation risks. From the press release, it's worth noting that the regulator is already approaching the ceiling for the interest rate, but it left a margin of 25 basis points.
However, markets were clearly expecting the Fed to announce the end of the rate hike cycle rather than mentioning a possibility of another hike. As a result, there was an increase in dollar positions across the market.

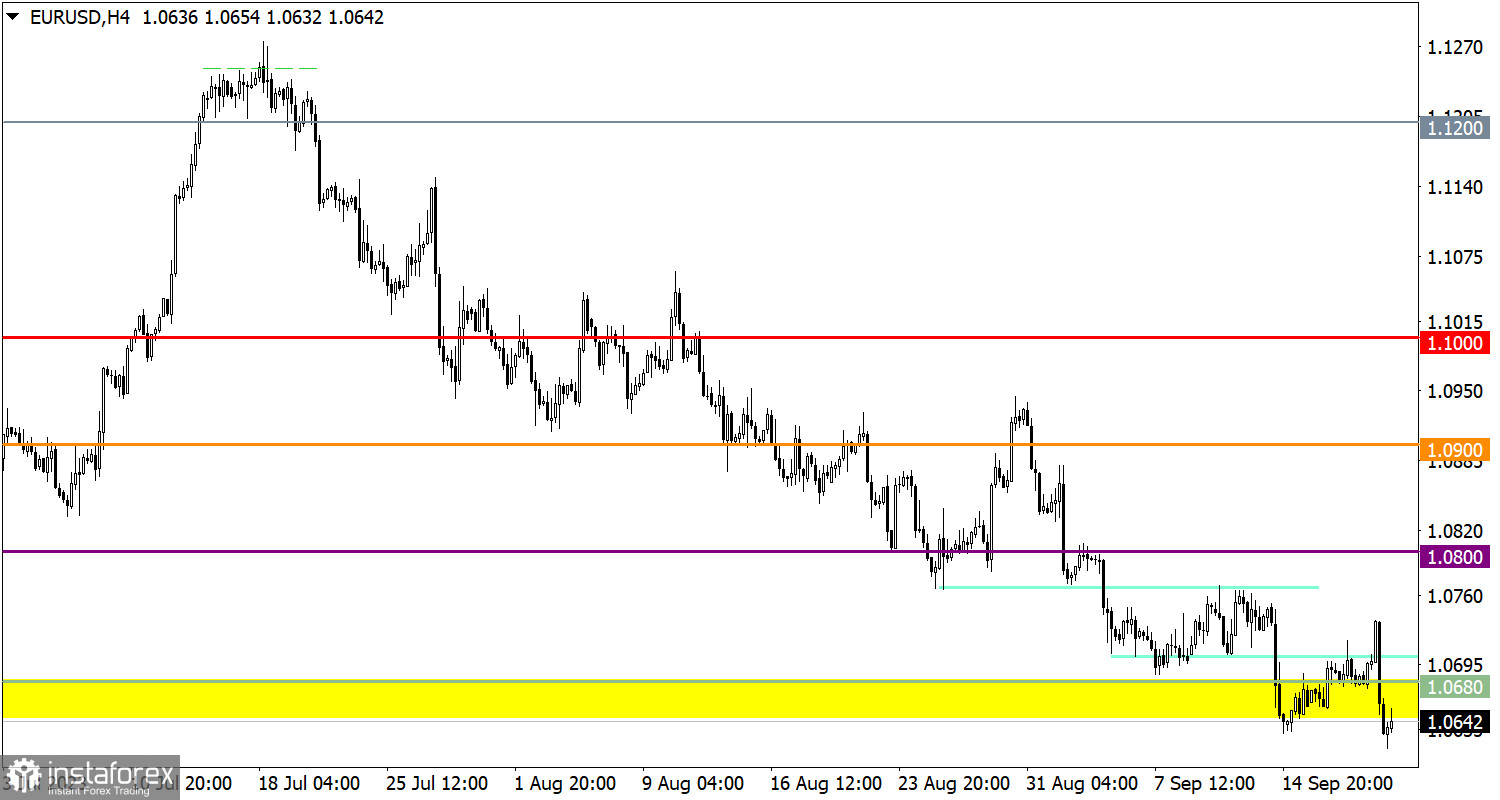
The EUR/USD currency pair not only resumed its decline but also managed to establish a new local low within the downward cycle. As a result, the exchange rate fell below the 1.0650 level, with a downward momentum of more than 100 points. The reason for such a significant price change lies in speculations related to the outcome of the Fed meeting.
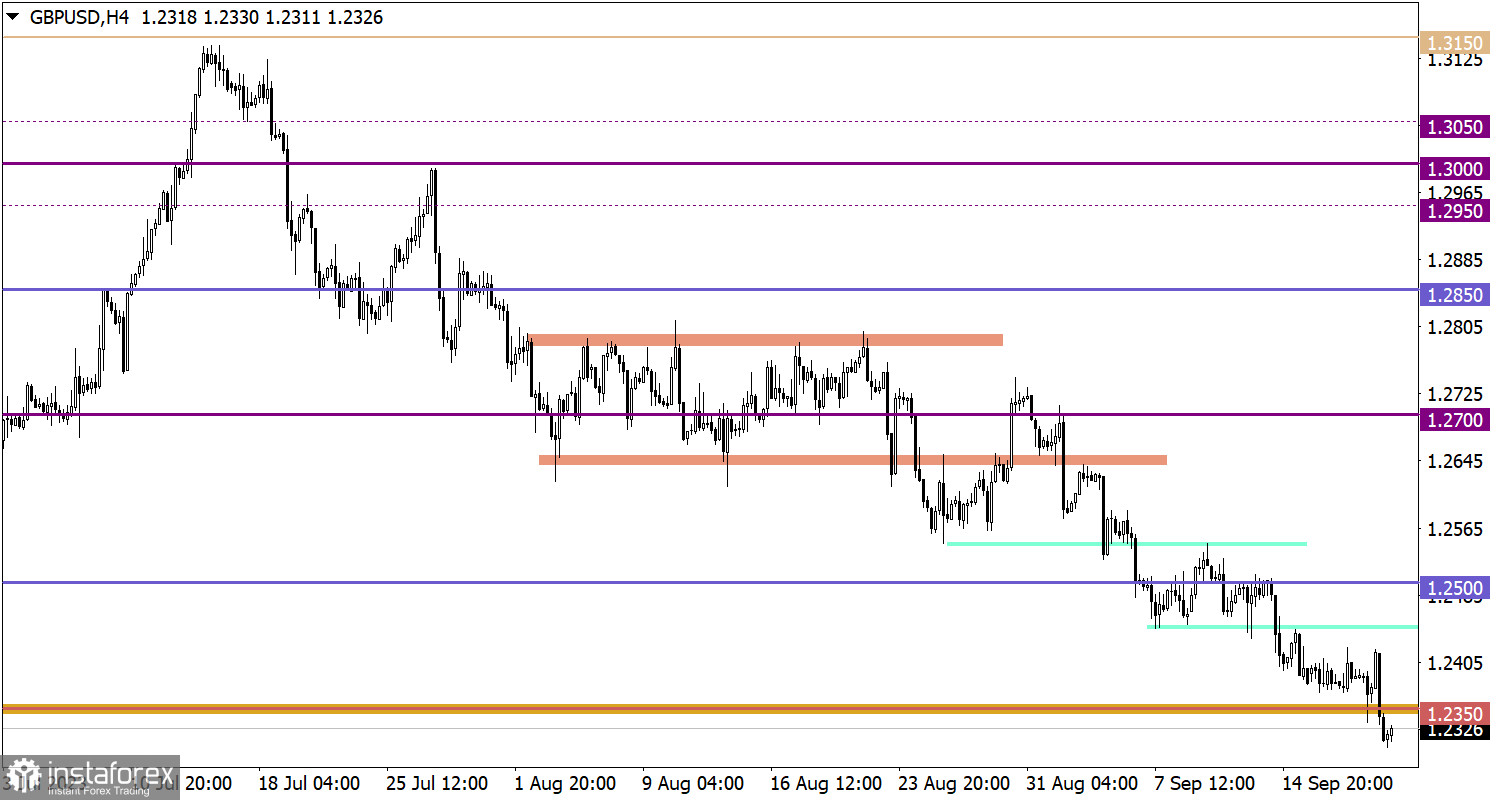
The GBP/USD pair extended its downward cycle due to a strong information and news flow. As a result, the support level of 1.2350 was breached.
Today, speculators are focused on the Bank of England's meeting, where analysts expect an interest rate hike to 5.5%. However, it's important to remember that recent inflation data showed a slowdown, which could change the Bank of England's rhetoric.
For a subsequent increase in short positions in the euro, it is necessary to keep the price stable below the 1.0600 level. In this case, the path towards the next control level of 1.0500 may open. However, it's important to remember that the exchange rate has already covered a significant distance, which implies an oversold status. Therefore, there may be a technical pullback in the market.
Speculators are mainly focused on the outcome of the Bank of England meeting. Depending on the information received, there may be impulsive price movements. From a technical analysis perspective, to increase the volume of short positions in the British pound, it is sufficient to see stable price retention below the 1.2300 level. Meanwhile, to increase the volume of long positions, it is necessary to return above the 1.2350 level.
The candlestick chart type is white and black graphic rectangles with lines above and below. With a detailed analysis of each individual candle, you can see its characteristics relative to a particular time frame: opening price, closing price, intraday high and low.
Horizontal levels are price coordinates, relative to which a price may stop or reverse its trajectory. In the market, these levels are called support and resistance.
Circles and rectangles are highlighted examples where the price reversed in history. This color highlighting indicates horizontal lines that may put pressure on the asset's price in the future.
The up/down arrows are landmarks of the possible price direction in the future.
¡Los informes analíticos de InstaForex lo mantendrá bien informado de las tendencias del mercado! Al ser un cliente de InstaForex, se le proporciona una gran cantidad de servicios gratuitos para una operación eficiente.


