 Permanecer
Condiciones de negociación
Products
Herramientas


European Central Bank Chief Economist Philip Lane announced a shift in monetary policy towards a more accommodative stance but also presented forecasts indicating the possibility of the first interest rate cut as early as the second quarter of next year. Furthermore, the refinancing rate could be reduced by 150 basis points over the next two years.
Based on this information, the euro accelerated its decline, and as a result, the British pound also shifted towards active weakening.

The EUR/USD currency pair concluded its pullback with a new surge in the volume of short positions. As a result, the local low of the downward cycle was updated, and the technical signal of oversold euro remains in the market.
On the other hand, the GBP/USD pair, during its inertial movement, does not respond to technical signals of oversold conditions. As a result, the exchange rate fell below the level of 1.2150, indicating significant speculative interest in short positions.
Today, the publication of data on durable goods orders in the United States is expected, with expectations of a decrease of 1.4% in the volume of these orders. This should be considered in light of the previous month when they fell by 5.2%. Thus, this will be the second consecutive month of declining orders for durable goods.
Durable goods orders reflect the state of consumer activity, which is a driver of economic growth. If the data confirms a decline in orders, this could put pressure on the dollar in the market.
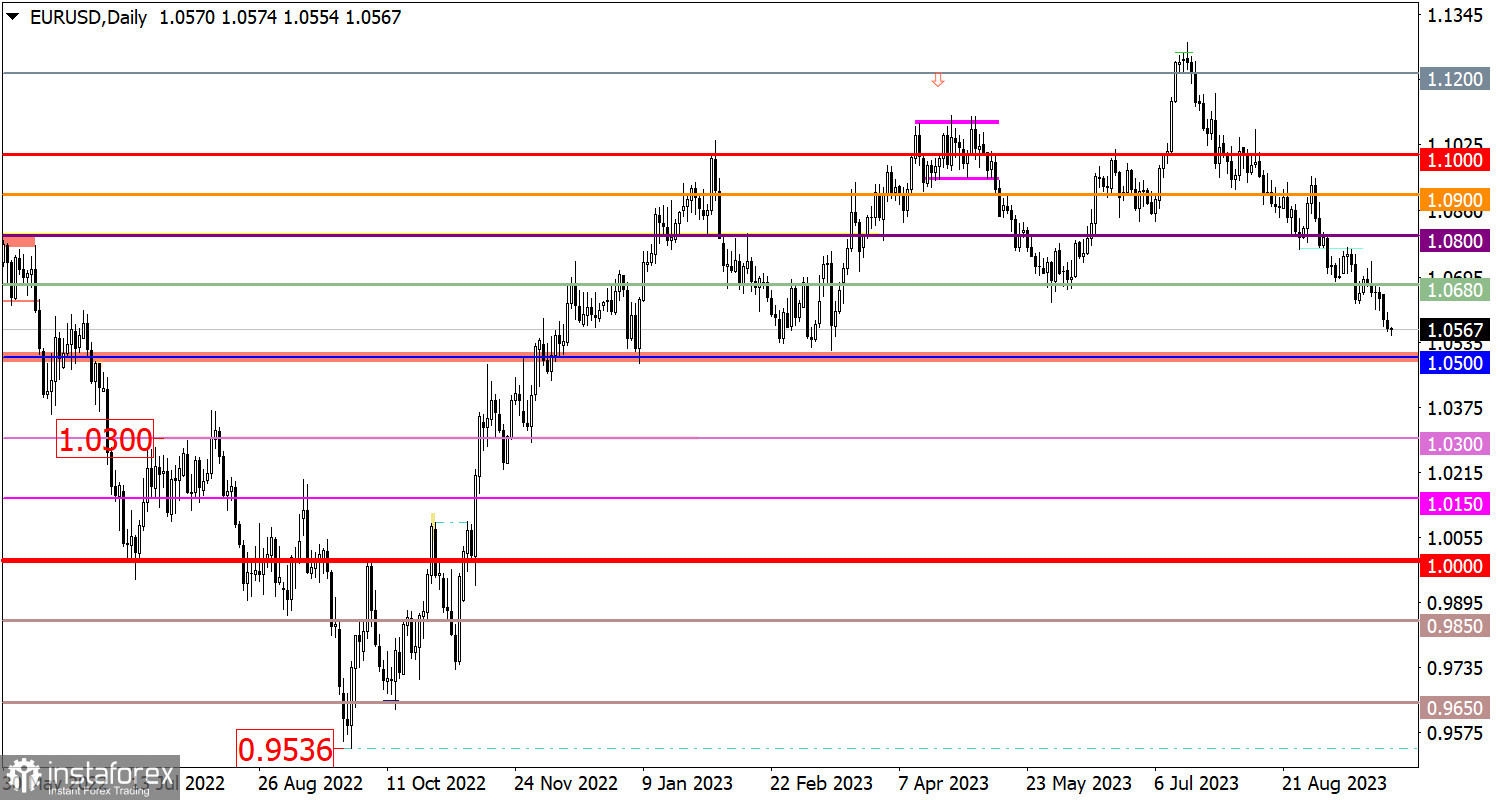
Based on the oversold signal for the euro exchange rate, it can be assumed that the support level at 1.0500 may play as support. In this case, there is a scenario of slowing down the current downward cycle within this level, which could lead to an increase in the volume of long-term positions, potentially resulting in a partial recovery of the euro exchange rate.
However, if speculators ignore the technical oversold signal and the exchange rate remains below the level of 1.0500 during the day, this could support the momentum in the euro market for some time.
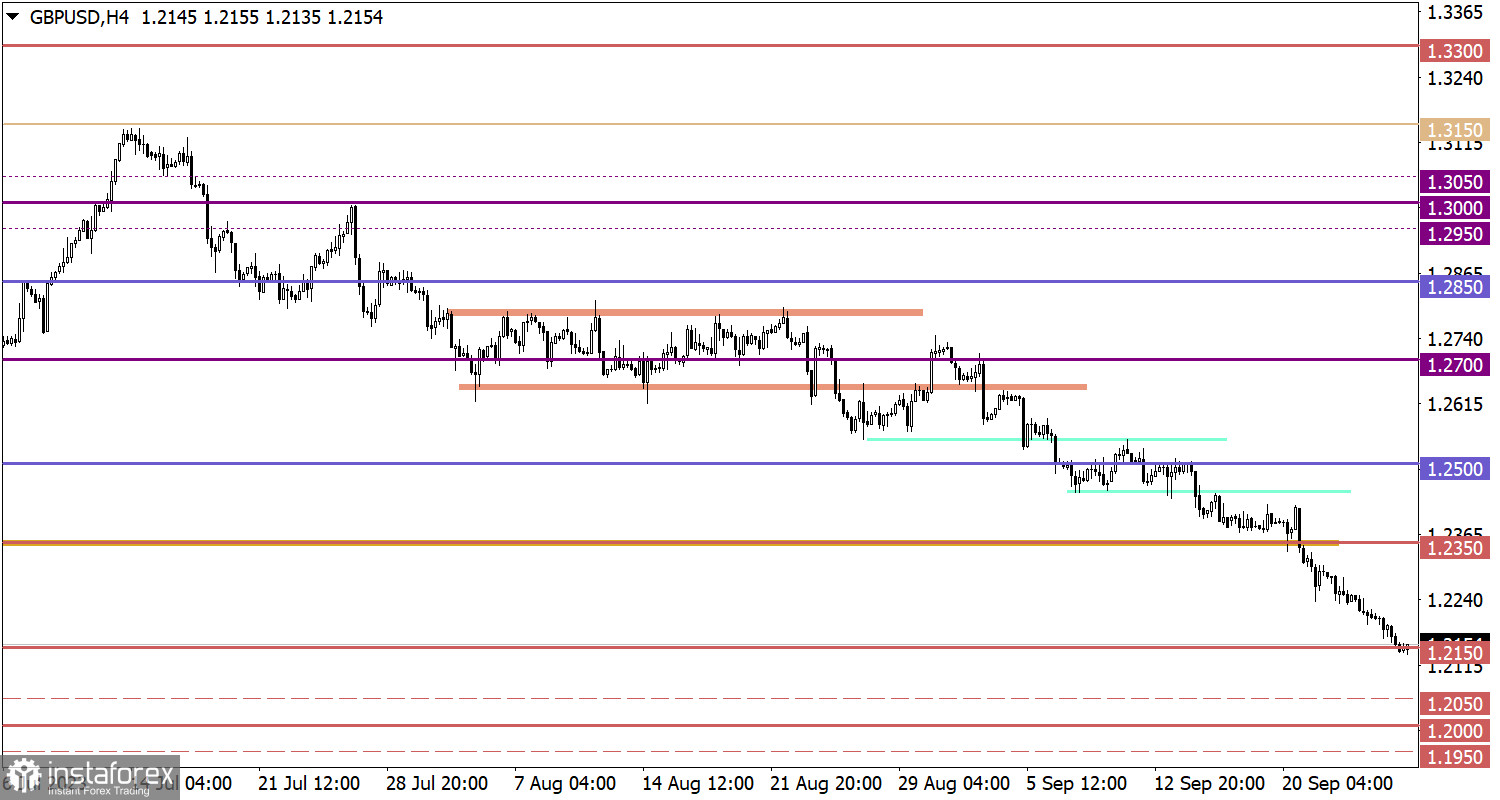
If the inertial movement continues in the market, and traders continue to ignore the technical oversold signal for the British pound, further depreciation of the exchange rate towards the psychological level of 1.1950/1.2050 is possible.
The candlestick chart type is white and black graphic rectangles with lines above and below. With a detailed analysis of each individual candle, you can see its characteristics relative to a particular time frame: opening price, closing price, intraday high and low.
Horizontal levels are price coordinates, relative to which a price may stop or reverse its trajectory. In the market, these levels are called support and resistance.
Circles and rectangles are highlighted examples where the price reversed in history. This color highlighting indicates horizontal lines that may put pressure on the asset's price in the future.
The up/down arrows are landmarks of the possible price direction in the future.
¡Los informes analíticos de InstaForex lo mantendrá bien informado de las tendencias del mercado! Al ser un cliente de InstaForex, se le proporciona una gran cantidad de servicios gratuitos para una operación eficiente.

