 Permanecer
Condiciones de negociación
Products
Herramientas


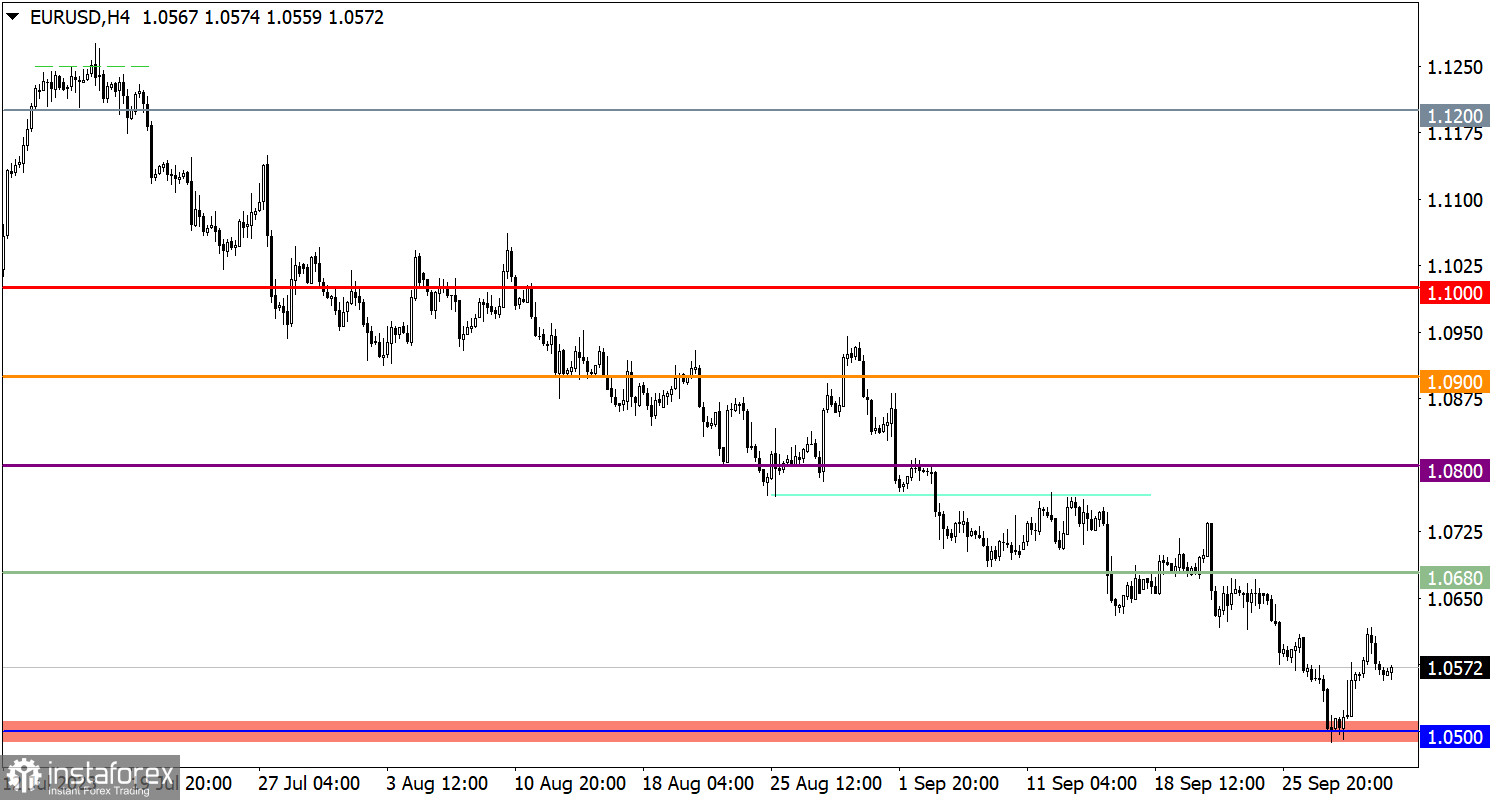
Inflation in the EU has slowed down even more than the most optimistic forecasts, decreasing from 5.2% to 4.3%. Analysts had expected a slowdown to 4.7%. Considering the new data, we should no longer expect an increase in the refinancing rate of the European Central Bank. At the same time, it is possible that we will see the first interest rate cut in the first quarter of next year. The reaction of the European currency corresponded to this development, as it started to weaken in value.
The EUR/USD exchange rate entered a correction phase after reaching the 1.0500 support level. This led to the strengthening of the euro by approximately 1%, or about 100 pips. However, the correction was short-lived, and around the 1.0600 level, there was an increase in short positions, once again affecting the decline of the euro's value.
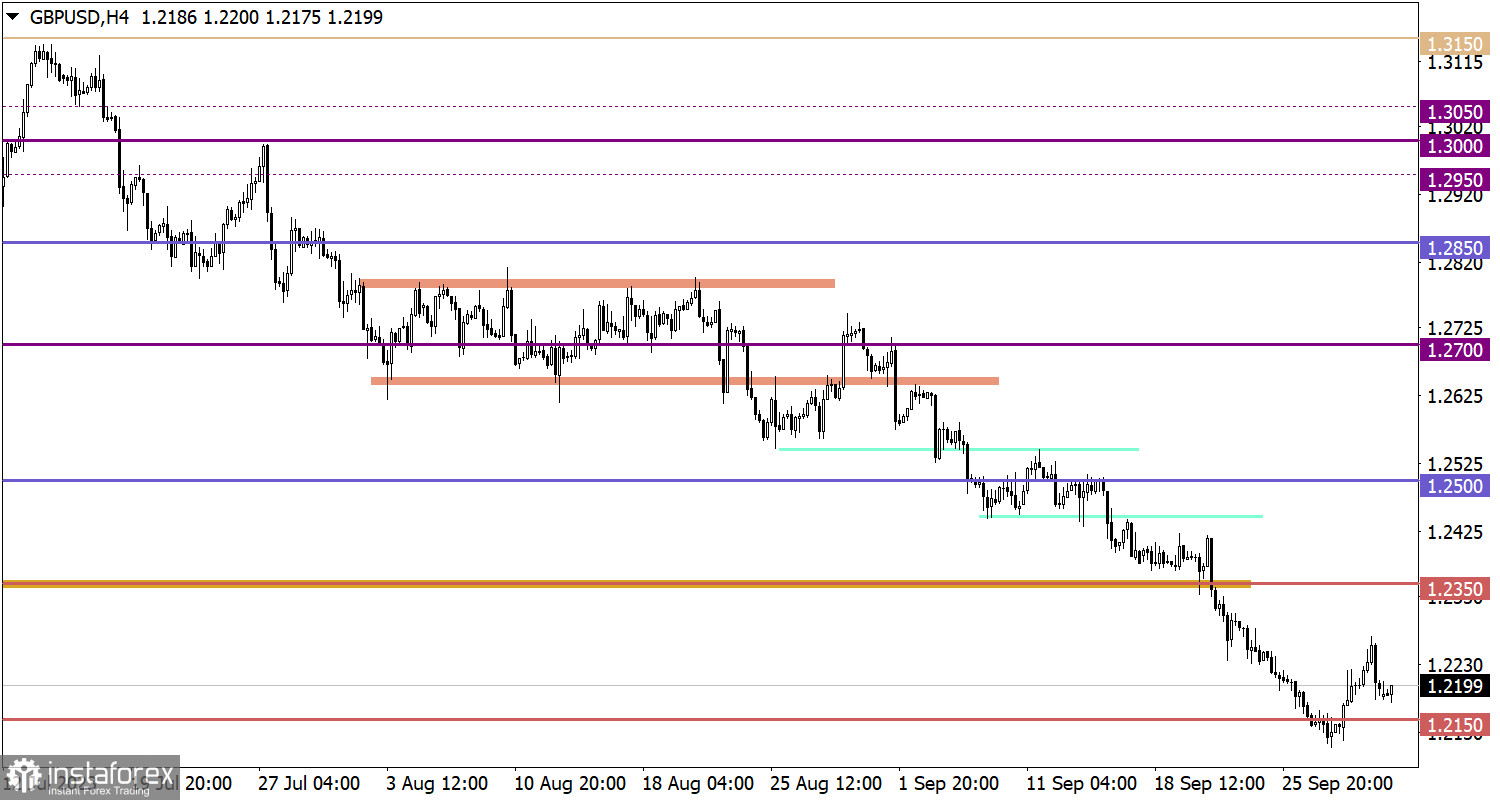
The correction of the GBP/USD pair also ended quickly, just as it began. Around the 1.2250 level, there was a reduction in long positions, contributing to a new wave of weakening in the pound sterling's exchange rate.

Today, data on the labor market in the European Union will be published, and forecasts indicate a possible increase in the unemployment rate from 6.4% to 6.5%. If these data are confirmed or turns out to be worse, it could exert additional pressure on the euro and contribute to its further decline.
If the EUR/USD exchange rate remains below the support level of 1.0550 and continues to decline towards the 1.0500 mark, it may signal the continuation of the downward trend. However, if the price returns above the 1.0600 mark, it could restart the corrective movement and increase long positions in the euro. The market will continue to react to news and fundamental factors, which can also influence the movement of the currency pair.
If the GBP/USD exchange rate stabilizes below the level of 1.2150, it could contribute to the continuation of the current downward trend. However, if the price returns above the level of 1.2250, it could create conditions for a corrective movement with an increase in long positions. It is important to keep an eye on news and fundamental factors as they can affect the direction of the GBP/USD exchange rate in the market.
The candlestick chart type is white and black graphic rectangles with lines above and below. With a detailed analysis of each individual candle, you can see its characteristics relative to a particular time frame: opening price, closing price, intraday high and low.
Horizontal levels are price coordinates, relative to which a price may stop or reverse its trajectory. In the market, these levels are called support and resistance.
Circles and rectangles are highlighted examples where the price reversed in history. This color highlighting indicates horizontal lines that may put pressure on the asset's price in the future.
The up/down arrows are landmarks of the possible price direction in the future.
¡Los informes analíticos de InstaForex lo mantendrá bien informado de las tendencias del mercado! Al ser un cliente de InstaForex, se le proporciona una gran cantidad de servicios gratuitos para una operación eficiente.


