 Permanecer
Condiciones de negociación
Products
Herramientas


The Producer Price Index (PPI) in the United States exceeded expectations and reached 0.5% on a monthly basis and 2.2% on an annual basis. This price increase in September indicates an increase in inflationary pressure on the American economy, which could lead to higher inflation.
The publication of this news provided local support for the dollar positions.
However, a negative factor for the dollar on Wednesday was the release of the Federal Reserve's meeting minutes.
Key points from the minutes:
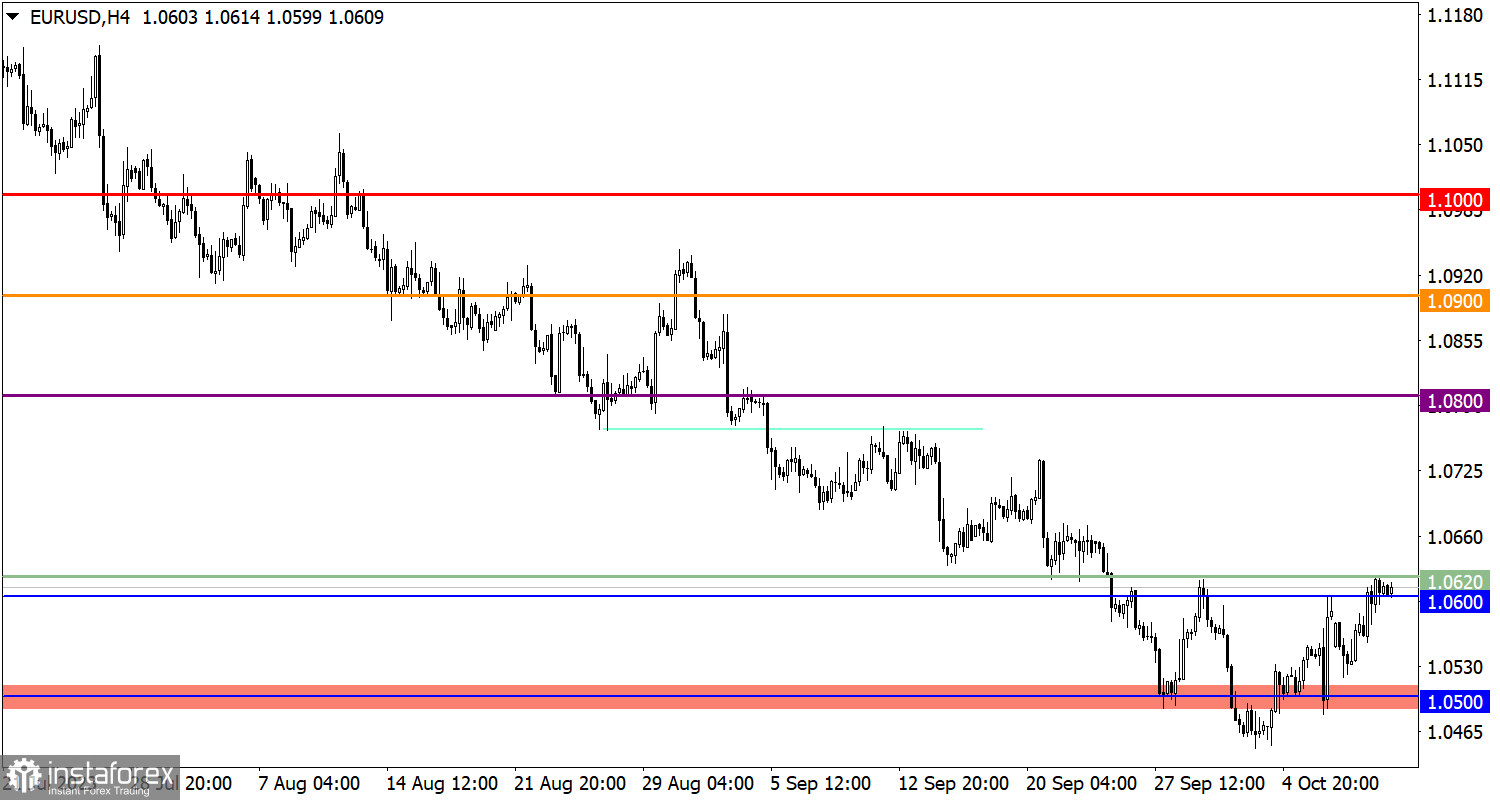
During the corrective phase, the EUR/USD currency pair successfully broke through the resistance range located between 1.0600 and 1.0620. This led to an increase in long positions and an extension of the upward cycle in the market.
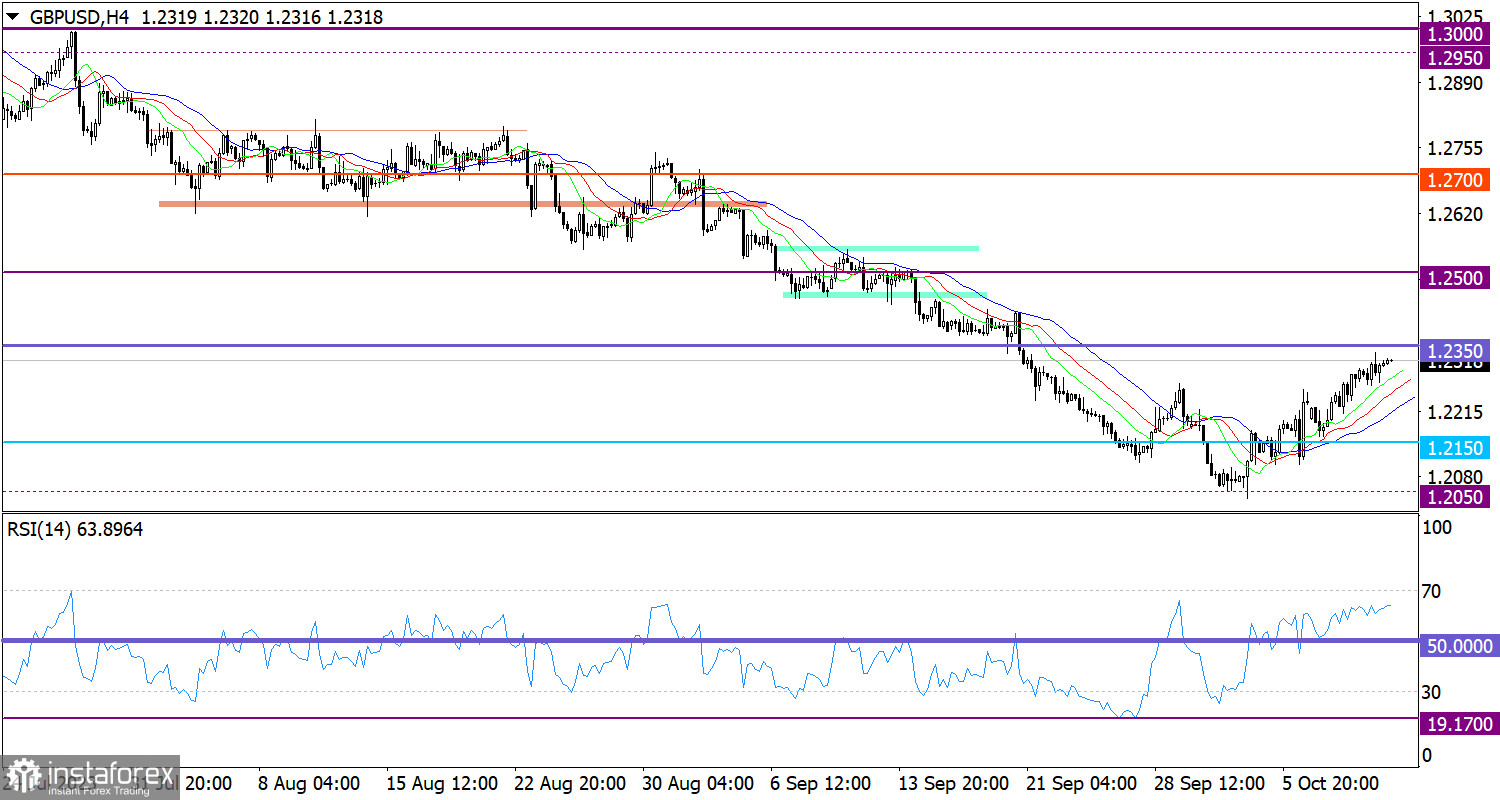
On the other hand, during the correction process, the GBP/USD currency pair almost reached the resistance level set at 1.2350. Since the beginning of the current upward cycle, the British pound has strengthened by more than 2%, which is about 300 pips.
Today, data on inflation in the United States is expected to be published, and it is forecasted that inflation will remain at 3.7%. Given the new data on producer price increases, some analysts speculate that the inflation level may rise, which could potentially impact the strengthening of the dollar positions.
From a technical analysis perspective, price stabilization above the resistance level allows for the subsequent rise of the euro's exchange rate. However, considering fundamental analysis, there is also an alternative scenario in which the dollar may regain its positions and direct the exchange rate towards the level of 1.0500.
The area around the level of 1.2350 may provide resistance for buyers, potentially leading to a partial recovery of dollar positions. There is also a scenario for the continuation of the corrective cycle if the price remains stable above the 1.2350 level throughout the day.
The candlestick chart type is white and black graphic rectangles with lines above and below. With a detailed analysis of each individual candle, you can see its characteristics relative to a particular time frame: opening price, closing price, intraday high and low.
Horizontal levels are price coordinates, relative to which a price may stop or reverse its trajectory. In the market, these levels are called support and resistance.
Circles and rectangles are highlighted examples where the price reversed in history. This color highlighting indicates horizontal lines that may put pressure on the asset's price in the future.
The up/down arrows are landmarks of the possible price direction in the future.
¡Los informes analíticos de InstaForex lo mantendrá bien informado de las tendencias del mercado! Al ser un cliente de InstaForex, se le proporciona una gran cantidad de servicios gratuitos para una operación eficiente.


