 Permanecer
Condiciones de negociación
Products
Herramientas


GBP/USD retreated on Wednesday, but it covered twice as much ground as the EUR/USD pair. However, there is a reason why the British pound fell. In the morning, the UK inflation report was published, indicating a slowdown from 6.7% to 4.6%. Experts predicted a decline to 4.8%, so the latest value exceeded the forecast, and inflation slowed down by 2.1%. We're going to give credit to the market, which traded consistently. If the dollar fell due to the U.S. inflation data, then the pound fell on Wednesday due to the UK inflation report. Therefore, everything is logical.
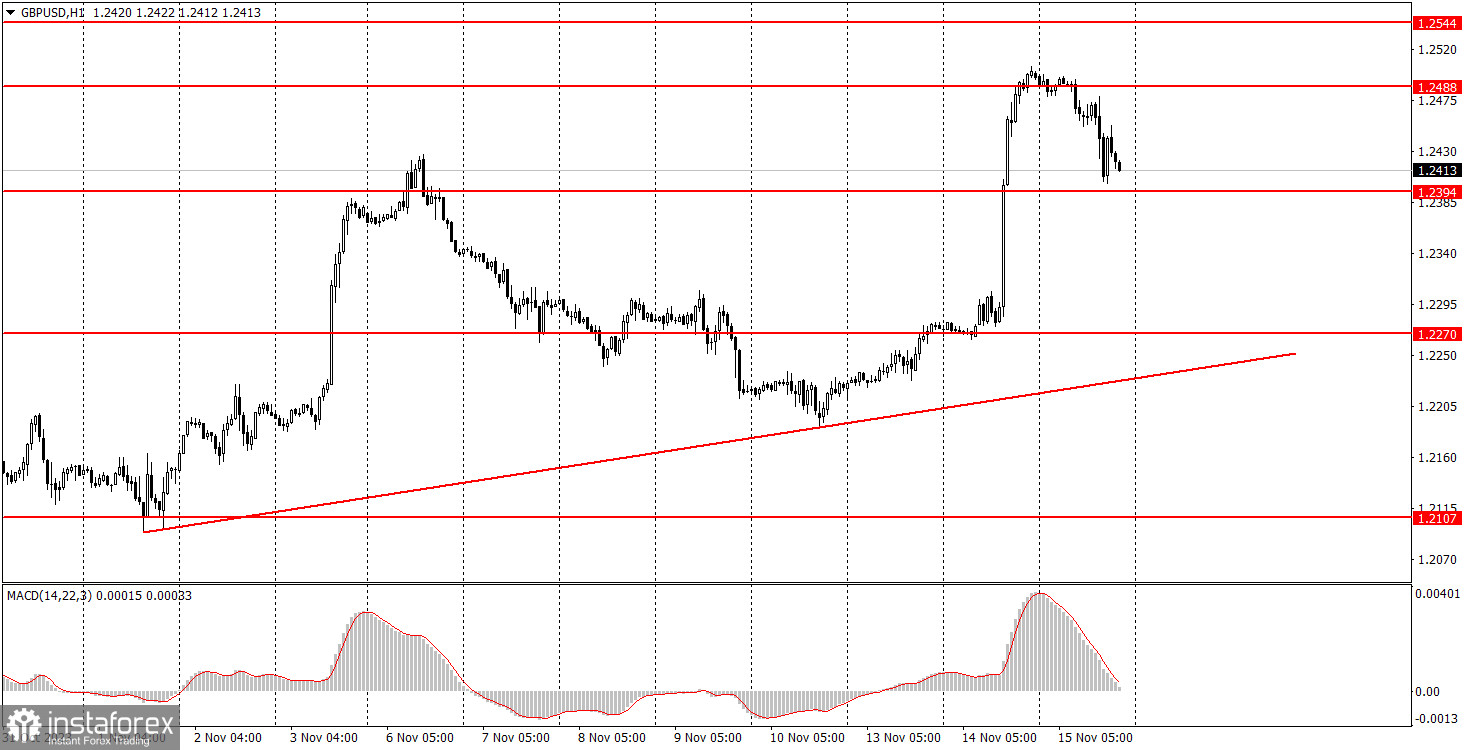
An ascending trend line was formed for the pound, so breaking it will confirm the end of the corrective movement that has been going on for a month. We did not expect the previous upward movement, but then again this month's US reports have been presenting several unpleasant surprises.
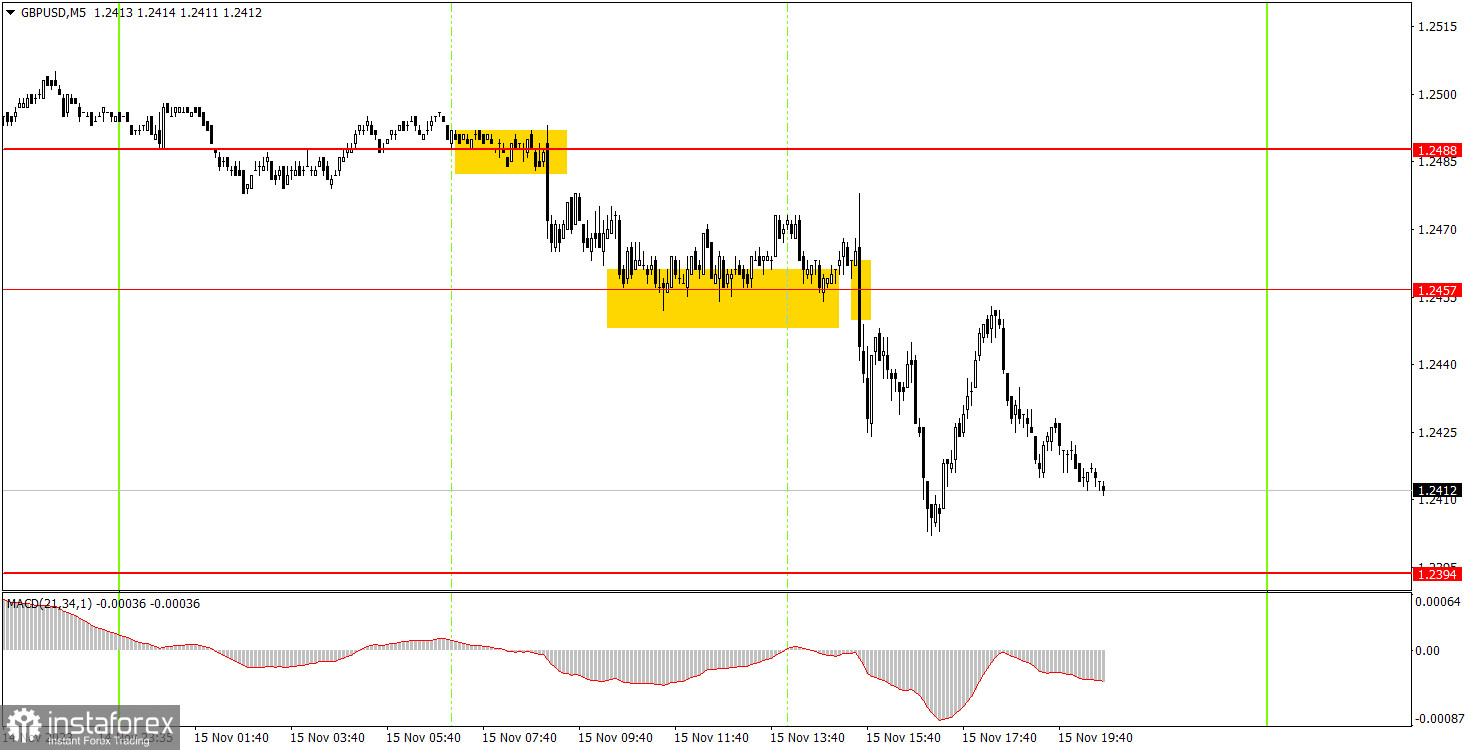
On the 5-minute chart, three trading signals were generated. First, the pair consolidated below the 1.2488 level, then falsely bounced off the 1.2457 level, and then surpassed it. The first short position only earned a few pips. The second long position turned out to be false, resulting in a loss of 25 pips. The third short position could have been profitable if beginners manually closed it when the pair approached the 1.2394 level. However, the pair did not reach the level itself, and later on it returned to the positions of forming a sell signal. Therefore, this trade could have been closed at breakeven using a Stop Loss.
On the 30-minute chart, the GBP/USD pair sharply and unexpectedly resumed its upward movement. But we still believe that it will end soon. Initially, we expected a more pronounced correction, and in the last week, the downtrend resumed. But in both cases, US data interfered, and we also have the market's inadequate reaction to the reports. The key levels on the 5M chart are 1.2052, 1.2089-1.2107, 1.2164-1.2179, 1.2235, 1.2270, 1.2310, 1.2372-1.2394, 1.2457-1.2488, 1.2544, 1.2605-1.2620, 1.2653, 1.2688, 1.2748. Once the price moves 20 pips in the right direction after opening a trade, you can set the stop-loss at breakeven. On Thursday, there are no interesting reports or events lined up in the UK, and only two secondary reports are scheduled in the US – on industrial production and jobless claims.
1) Signal strength is determined by the time taken for its formation (either a bounce or level breach). A shorter formation time indicates a stronger signal.
2) If two or more trades around a certain level are initiated based on false signals, subsequent signals from that level should be disregarded.
3) In a flat market, any currency pair can produce multiple false signals or none at all. In any case, the flat trend is not the best condition for trading.
4) Trading activities are confined between the onset of the European session and mid-way through the U.S. session, after which all open trades should be manually closed.
5) On the 30-minute timeframe, trades based on MACD signals are only advisable amidst substantial volatility and an established trend, confirmed either by a trendline or trend channel.
6) If two levels lie closely together (ranging from 5 to 15 pips apart), they should be considered as a support or resistance zone.
Support and Resistance price levels can serve as targets when buying or selling. You can place Take Profit levels near them.
Red lines represent channels or trend lines, depicting the current market trend and indicating the preferable trading direction.
The MACD(14,22,3) indicator, encompassing both the histogram and signal line, acts as an auxiliary tool and can also be used as a signal source.
Significant speeches and reports (always noted in the news calendar) can profoundly influence the price dynamics. Hence, trading during their release calls for heightened caution. It may be reasonable to exit the market to prevent abrupt price reversals against the prevailing trend.
Beginners should always remember that not every trade will yield profit. Establishing a clear strategy coupled with sound money management is the cornerstone of sustained trading success.
¡Los informes analíticos de InstaForex lo mantendrá bien informado de las tendencias del mercado! Al ser un cliente de InstaForex, se le proporciona una gran cantidad de servicios gratuitos para una operación eficiente.

