 Permanecer
Condiciones de negociación
Products
Herramientas


Retail sales in the UK reflected an acceleration in the pace of decline from -1.3% to -2.7%, but these figures had virtually no impact on the value of the British pound. It is worth noting that these data are not just weak; they came out worse than expected, as a decline to -2.4% was anticipated. Meanwhile, the market seemed to overlook these negative statistical data.
The final data on inflation in the EU confirmed the preliminary estimate at the level of 2.9%. This indicator had already been factored into the quotes, thus the lack of market reaction.
What led to sharp price changes during Friday?
Representatives of the Federal Reserve System delivered speeches on Friday. Almost all heads of the Federal Reserve Board unanimously stated the need to halt the tightening of monetary policy, thereby confirming investors' expectations of the imminent start of an interest rate reduction cycle.
Based on this information, traders increased the volume of short positions on the U.S. dollar.

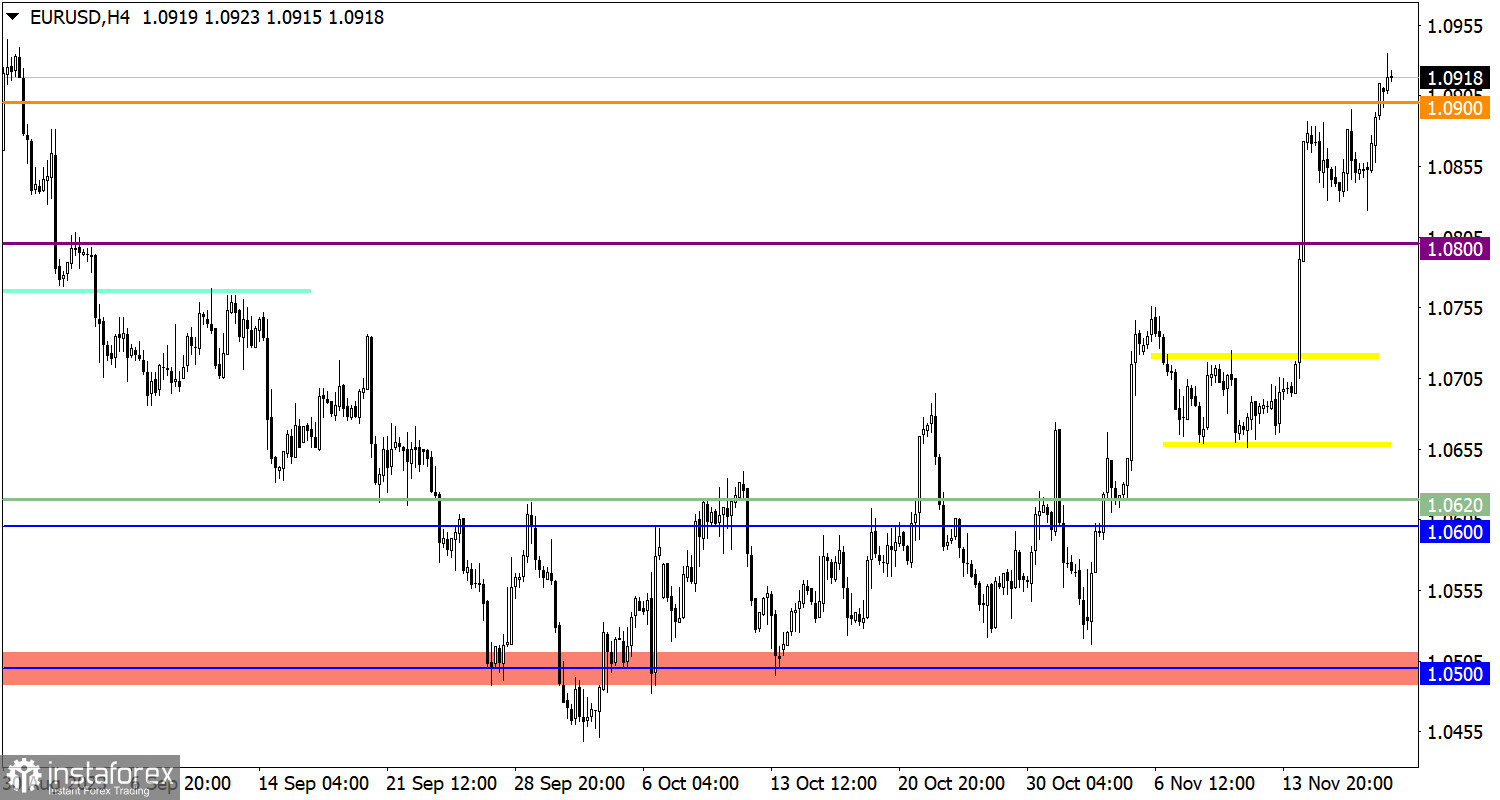
The EUR/USD currency pair ended a three-day consolidation with an upward impulse, leading to an increase in the volume of long positions and prolonging the upward cycle.
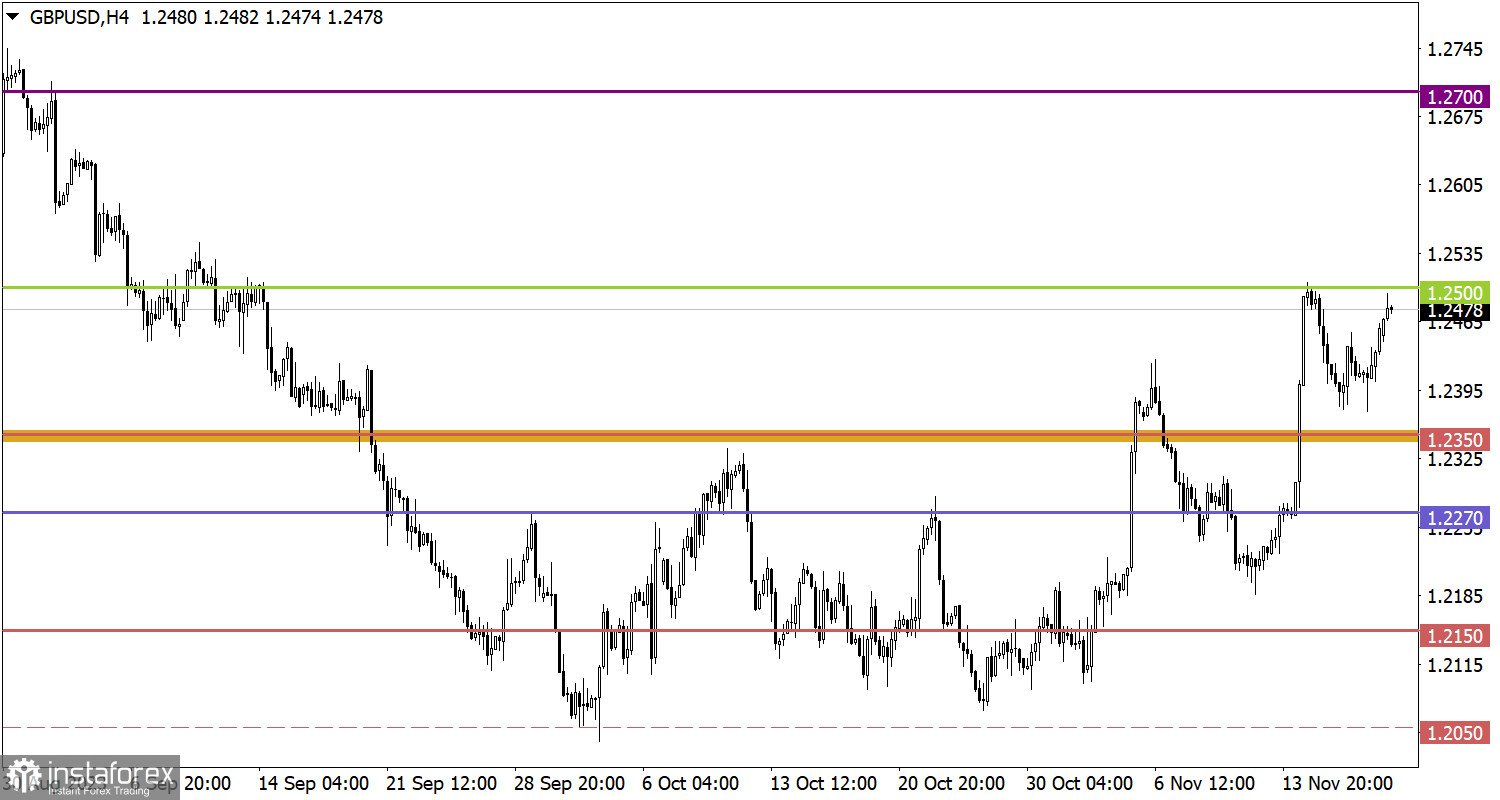
The GBP/USD pair completed a correction stage with a phased increase in the volume of long positions. As a result, the quote returned to the area of the local high, where the resistance level of 1.2500 is located.
Monday, as usual, is accompanied by an empty macroeconomic calendar. The publication of important statistical data in the European Union, the United Kingdom, and the United States is not expected.
In this regard, investors and traders will likely rely on incoming news flows to make market decisions.
In the case of further growth, movement towards the psychological level of 1.1000 is possible. This price step will indicate the recovery of the euro's value relative to the decline during the summer. However, if the price returns below the level of 1.0900, the volume of long positions may decrease, which, in the theory of technical analysis, could lead to a pullback formation.
For further growth in the value of the British currency, the quote needs to stabilize above the level of 1.2500. In this case, further growth in the volume of long positions is possible, based on which a phased recovery of the pound's value is allowed.
The candlestick chart type is white and black graphic rectangles with lines above and below. With a detailed analysis of each individual candle, you can see its characteristics relative to a particular time frame: opening price, closing price, intraday high and low.
Horizontal levels are price coordinates, relative to which a price may stop or reverse its trajectory. In the market, these levels are called support and resistance.
Circles and rectangles are highlighted examples where the price reversed in history. This color highlighting indicates horizontal lines that may put pressure on the asset's price in the future.
The up/down arrows are landmarks of the possible price direction in the future.
¡Los informes analíticos de InstaForex lo mantendrá bien informado de las tendencias del mercado! Al ser un cliente de InstaForex, se le proporciona una gran cantidad de servicios gratuitos para una operación eficiente.


